
In this article am going to show you step by step how I can predict the future price of bitcoin by using technical analysis based on supply and demand strategy with the help of Fibs levels.
In this article, you will start to see the market from the bigger timeframe (monthly) up to the entries time frames (daily).
But before going any further, remember that in this article am not going to give you any financial advice, any kind of investment you wish to do must base on your own decision.
Bitcoin Monthly Timeframe.
When you want to perform a correct technical analysis, the first thing you have to do is to start with the bigger time frame. But why I say this, a bigger time frame is important to analyse because it shows you where the market is going (market direction).
If you are a long term investor, the monthly timeframe will always be your wife frame, you must marry it. But I do not mean short term investors are not required to use this timeframe No! Both must start on that timeframe.
In bitcoin monthly timeframe reveals the price now is strongly moving downward to test the 50.0-61.8 Fibs levels. See the screenshot below;
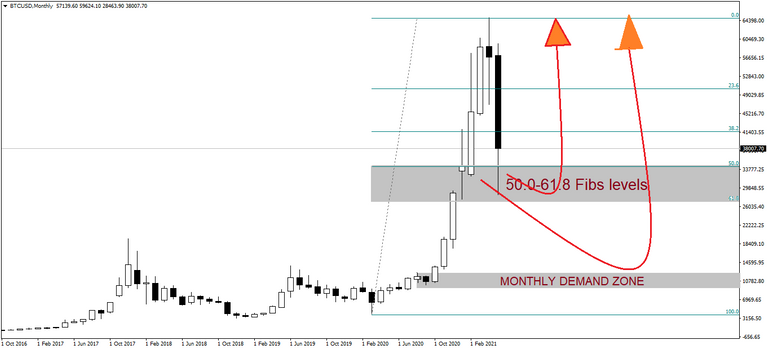
If the price break this fibs level which is around 35000 to 26000, what we expected is the price to fall directly to our monthly demand zone which is found around 12000 to 9900, which is too deep.
For my observation on the monthly timeframe, I do not think that Fibs levels will succeed in handling that strong down movement of bitcoin price. That level is too weak, why is the weak area? I said that because it does not have any other support demand zone or resistance line that occurred around the levels.
Bitcoin Weekly Timeframe.
This is another best timeframe that you can use to understand market direction. Probably I can say many swingers or short term investors use this time frame to know if the market is on an uptrend or downtrend.
Compare with the monthly, weekly show the clear picture of the market, if the market is on the uptrend in weekly you will see higher high and higher low structure or lower low and lower high for the downtrend.
Bitcoin weekly timeframe show market is on the downtrend, which means that price fails to continue to form higher high and higher low market structure and break the higher low to start to form lower. See the screenshot below;
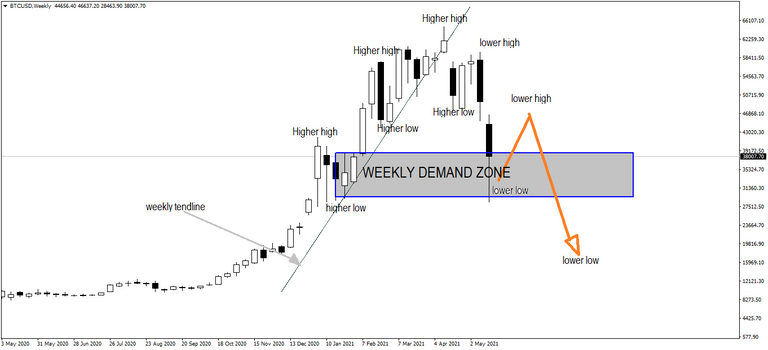
As you see on the bitcoin weekly timeframe, price break the weekly uptrend and now price form lower low around the demand zone.
We don't have any support/confluence from the monthly time frame to give us an edge if the market can go up, so what we expected is the price to correlate or move up to form a lower higher before continuing to go down.
Bitcoin Daily Timeframe.
To get a clear entry setup, a daily timeframe is the best time for entry but if you a long term investor. By using this time frame you get a good risk to reward for your long term investment.
Let us see what the bitcoin daily timeframe tell us;
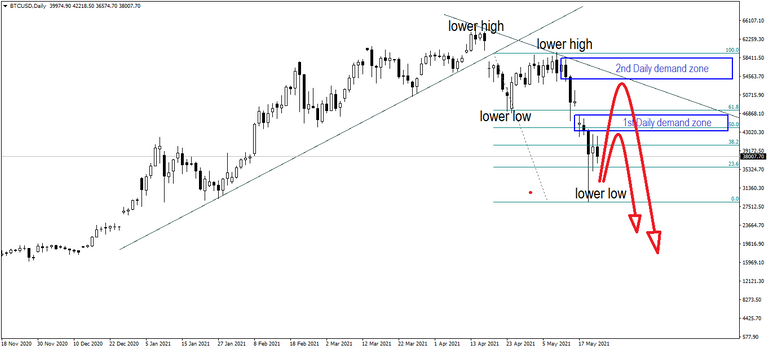
In the daily time frame, we see a clear downtrend with lower low and lower high structure, where now the market is on the way to form lower low.
With the daily timeframe, we have two best entry option, first entry option is around the first daily demand zone and 50.0-61.8 fibs levels and the second one is around the second daily demand zone which this second is found around the daily down trendline.
On the daily chart when closely you can see these two entries they have more than two confluence which means they are very strong entry, but these are for the one who is a short term investor.
Conclusion.
Trading or investment involves high risk, before putting your money in any kind of investment make sure you have experience. Do not forget to use the proper risk management and invest the amount of money that you can afford to lose.
Posted Using LeoFinance Beta