With the year that we are having, we were really looking forward to Christmas celebrations, but like many out there, we will spend the time as just our family, with no relatives coming at all. This has left us with a little bit of an issue as our daughter is expecting us to all open presents, but my wife and I don't actually have any presents for each other at all, so will have to think of something. What we have decided on is joint presents and just buy and wrap things that we already need anyway, like a toaster. Exciting!
One thing I was hoping to do before Christmas and our move upstairs, is the wardrobe storage system, but due to Covid, that isn't going to happen either. We had decided on a very cheap and easy option from IKEA, that has bars drilled into the wall and hooks that hold shelving, baskets and hanging rods in place - the problem is that they don't have some of the necessary components in stock and they don't really know when they will get some. While they have an estimate, we can't even order what we need and put them on hold, we have to keep checking the stock levels online.

The delivery estimate is over a month away - which is highly unusual for IKEA, but is to be expected for how this year has gone overall - ridiculously. So much disruption caused and while things like this are minor in importance at the end of the day, it is an indicator for all of the other factors that have made their way into the new normal, one where people seem to be relatively happy to become accustomed to.
I was reading an article about how Australians are "sitting pretty" as there has been a 1.7% increase in average wealth, but there was no mention about the spread of that wealth. Averages are very poor indicators of reality when like I mentioned a few weeks ago, the 200 richest people in Australia added 25% to their wealth since March. Does that sound average, or is it when the richest 1% or so are adding that kind of percentage gain, the averages are skewed?
The problem that I find with these kinds of articles is that they position the reader with a perspective as if things are going well, but when it comes to averages, The distribution has to be taken into account. For example, imagine a bus with 100 people on it with an average wealth (all assets and holdings) of 1M dollars. What does this really say about the group? To me, it sounds like they are doing pretty well - but if one person gets off that bus and the average drops to 100K, it tells a very different story. While everyone on the bus combined was worth 50M, in reality 99 of them were worth 9.9M and one person was worth 90.1M. This is pretty much what it looks like in most countries, though - the 0.1% don't catch the bus.
The other problem is when we compare ourselves against the average to get an understanding of how we are doing personally. For example, in the US where 70% of the population are overweight and 40% are very overweight - the average weight is likely not going to be what most healthcare professionals would consider "ideal" for health. Yet, a person under average weight could still frame themselves as doing better than the average and feel good for it. After all, it could be worse.
"Yes, I am a serial killer who killed five people, but that is half less than the average serial killer, so I am really not that bad of a person and should have my sentence shortened".
But, most of us don't visualize numbers well, so when we hear the averages of the economy and position ourselves along the scale, we might feel good about ourselves. However, the average wealth per capita in Australia is $441,649, which is less than the average price of city homes in every major city in the country, but is close to the bottom set and a little more than the average apartment price except for in Melbourne (20% less than average costs) and Sydney (40% less than average costs). This says that the average Australian wealth doesn't cover most people's home, which makes sense as the home is most people's largest investment, but it takes a long time to actually own it.
This average is very skewed in my opinion, as while the averages might be up, it is likely being driven by a very narrow proportion of the entire community, likely the rich and the retirees who have actually paid off their houses. I would predict that a far greater majority of Australians don't have anywhere near that wealth and a recent survey found that 70% of Australians had no secondary account set aside for emergency situations. That sounds more realistic, where a lot of people are living far more hand to mouth than the averages would indicate.
I know that for my wife and I, if we were to tally up together what we were worth in total, it wouldn't come close to that kind of amount, as the largest asset we have is our house and we only have about 30% ownership of it, considering what we have put in and what we are likely to be able to sell it for if we had to. We are likely below average in Finland however, since there is no inheritance money to bolster our wealth and my wife earns a fair amount under the average salary in Finland - although she is likely actually not that far under average.
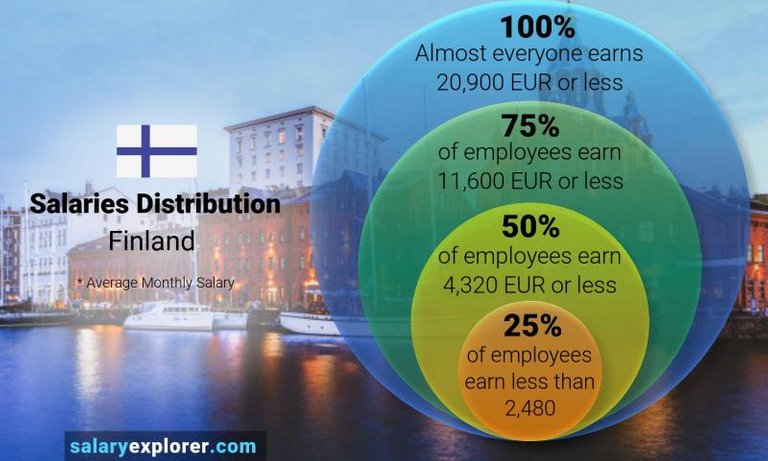
While the median salary is 4300, 25% earn less than 2500 - A large gap of 1800€. This is significant, considering the minimum salary is actually 1100€ a month. But, what is even more important is that 25% of the people earn more than 11500, which is 7200 more than the median - that difference alone is almost 3x more than the bottom 25 of employees. This indicates a rapid climb the closer one gets to the top, with a greater degree of spread between people. so, while the median salary might be 4320, it doesn't actually mean that the average person earns anywhere near that number.
so, if for example we do some janky math with 100 people using the average between the limits.
25 people earn 1800
25 people earn 3400
25 people earn 7950
25 people earn 16250
25x1800= 45,000
25x3400= 85,000
25x7950= 198,750
25x16250= 406,250
Monthly total = 735,000 earned per month
This means that the "average salary" of the 100 people is 7350€ per month. Which is 7x more than minimum salary. 3x more than the upper limit of the lowest 25%. 70% more than the upper limit of the bottom 50% (the median) and 50% less than at least 25% of the population at the top. This math is inaccurate for sure, but you get the idea.
Or put another way. per month in salary earning:
25% generate 1/16th
25% generate 1/9th
25% generate 2/7th
25% generate 3/5ths
Now as a reminder, these are salary earnings - not what these groups will also earn through investments. As you could likely assume, the upper brackets are likely more invested to passively earn than the lower. Salary and wealth are different animals.
As I see it, even the "median" salary is not going to give an accurate portrayal of just how much variation there is between earnings and it definitely doesn't tell about the variation in life experience. In a country as expensive as Finland, the differences are large, yet, in other countries I suspect there is a far greater variation between the numbers. But, some people seem to use these types of averages as indicators of standards, but I am not sure how useful they are at the practical level. In many ways, it is like the images depicting "Expectation vs Reality" - where the expectation paints a pretty picture, the reality is something altogether different.
While it is easy to accept articles that use numbers and averages to support their story, I think it is wise to take them all with a grain of salt, as while the numbers might be accurate, they don't necessarily provide a lot of information on where things currently stand. I suspect that the increase in Australian average wealth is due to a minority percentage increasing their value significantly over the last 9 months through increases in investments and the value of their properties, but the average Australian is likely not sitting quite as pretty as the media will have us believe.
Taraz
[ Gen1: Hive ]
Posted Using LeoFinance Beta
The average person has fewer than two legs.
lol. Never thought about it before. :D
Statistics very rarely add up to meaningfulness. A good man at numbers can make them say what he wants them to say, if people have not figured that out, they have to much trust in the numbers men, and may be to fixed in their outlook.
As for a toaster for a Christmas gift, I think it would be a wonderful family gift. I lived without a toaster for a lot of years, toasting bread in a pan or in the oven under the broiler is a pain, sometime literal pain when you reach in to flip the bread and toast the other side.
I think it is even more difficult these days, as there are not only many ways to position them, but there are plenty of ways to increase their visibility with a target audience. No matter the position, there is always an expert out there willing to go against it.
The best toast is made on an open fireplace, but it isn't very practical :)
Posted Using LeoFinance Beta
I had one of those four sided campfire toaster stands, it did do a pretty good job, you just had to remember to not play with the fire while making the toast, some ash was okay, but not a whole lot of it.
As a kid, there were rare times my family would gather around the dying fireplace late at night and toast fresh bread with butter and jams. I don't have many find childhood memories, but that is one of them
On average, the media is mediocre which does not mean less than 99 % of the media have actually above 1 % of usefulness to the average person. On the other hand, they might be on average 99 % useful to the person who owns 99 % of the media in the country.
It's mostly become manipulative essays instead of serious analysis even where you would have expected the latter. While there were genius people working in the field decades ago, I expect more...automation coming into the industry. On average, the people who write the news could be replaced by bots already.
Not only one person owns 99% of the media - it is more like five or six people... :D
I suspect that much of the news is already written by bots, with a great deal of it coming with no byline. It is mostly syndicated trash and opinion pieces that interject twitter quotes as evidence.
Posted Using LeoFinance Beta
Dear @tarazkp, Do you mean that humans are currently dominated by artificial intelligence bots? Do the few people who create and rule artificial intelligence bots rule the world?
You can't trust official media statistics!! ¡Never! Of any kind...
I thought: Wowza!! the good old @tarazkp must have written something very juicy there. I have to check it! And then... you know what happen. :)
Some of my others have 15000 on them. That's how popular I am.
Really? Are you serious? Show me! ...I have to see those official statistics right now!
It is on random refreshes.
Oh! then no chance to criticize the "media platform" right away?
Talouselämä is a major finance journal.
The data is from last year. The median monthly salary was €3278 or $3902. That is, out of all full-time wage earners 50% earn more and 50% earn less. (In the beginning of the article outside the paywall it read that the figure was for full-time wage earners.)
€4320 is simply not correct. Not even the average is that high.
$3902 is not that bad, though. It's surprisingly good. A good chunk of that is eaten by income taxes and pension contributions. But in exchange for those, what we pay for healthcare is nominal relative to the actual cost, higher education is free of charge and there is a monthly allowance of about €300 paid to those who are completing their first degree, etc. etc. So, no need for a college fund or very expensive health care insurance. The means tested maximum cost of daycare is about $300 per child per month, which is a huge benefit as the cost of daycare in a municipal or a private daycare center is over $1000 per month per child.
Posted Using LeoFinance Beta
My wife has moved into head hunting lately and is getting a view of what people are earning in a range of jobs and I would suggest that the median is higher than what you have posted here. She has been very surprised at what some people earn in what she would have thought would have been much, much lower. It has opened her eyes to the reality of it and her own position.
I would also predict that when it comes to wealth, above the salary also comes in things like share options, which wouldn't appear in the salary calculation, nor would capital gains.
That in itself does not say much about the entire country. Is she in the HR department in some tech company? Surely, hers is a biased sample.
The median wage earner need not bother with such things. Very few nurses, supermarket managers or people like that are offered share options or anything like that.
The median is the middle position, not the average.
Here's the source:
https://www.stat.fi/meta/til/yskp_en.html
At the smaller agency she hired for all kinds of businesses, well-known tech too. In her current internal role it varies from the bottom to the top, and in headhunting, it is obviously at the higher end of the spectrum to warrant the time and effort involved.
Yes, you are right, the median wage earner need not bother, which is my point. Above the salary, there are host of other earning factors that come into play, which is why salary alone is not a good indicator. I would say that while average wealth has increased, it probably hasn't much at all for the lower 50%. The gap between just keeps increasing. People below the line worry about how much they get paid to be able to pay the bills, people above about how much their investments are worth and the ROI. I know people earning 6 figures in Finland and their investment returns are worth more.
Yet, if you look at the public tax data, there do not seem to be to many of these high earners.
The taxable incomes of everyone with a total income including earned income and capital gains exceeding €100k is published in the papers. I think it's a terrible practice exposing some of these people to envy or worse like making them preferred targets of scammers or worse. But it gives us a nice data set to draw upon.
Check this out, for example:
https://verokone.hs.fi/
The national median income was €24,766 in 2018. That includes all income earners, not only wage earners.
If you made €150,000 or six times the national median, you're in the top 1,31%.
That's an awfully flat distribution!
For example, in my region you'd be in the top 927 by earning a paltry combined €130,000 in earned income and capital gains. The population is 200,000 of out whom about 80% are presumably legal adults as in the entire country. So, out of roughly 160,000 people only 927 earned a little more than €10,000 a month.
https://www.iltalehti.fi/verokone
Oh, she has been in recruiting for a while, both for a smaller agency and a large Finnish corporation now - she has hired for many levels of positions over the years. What I wonder is, what does the average Finnish employee profile look like - is it the office worker or the warehouse worker, the white collar or the blue? What do you think a full time person working at a Supermarket register earns per month?
Posted Using LeoFinance Beta
There is no such thing as average employee profile because there are so many different kinds of jobs. You could list some of the most common categories by industry. I suppose transport is a pretty common one.
"Office worker" would be a near useless categorization as it would cover a large percentage of the work force.
I don't know how much a full-time supermarket staff make. I imagine their monthly gross earnings could be something like €1800 per month while not accounting for extra for hours done outside of the regular office hours.
I think it is interesting, as there is very little visibility on what kinds of worker demographics there actually are out there.
Do you think 1800 in Finland is enough for ~160 hours a month?
€1800 minus 17.4% in taxes, unemployment insurance and pension contributions equals €1487 for a single and childless person where I live. If your rent is €487, you're left with €1000 to cover the rest of your expenses. Should be doable but you can forget about any expensive luxuries.
I can't remember. What was it for unemployment and rent assist benefits?
About €1000 for a single childless person.