In this post I will first give some simple trading tools for technical analysis, give brief description of each on how it works and in the end will give a simple trading example using one of the tools.

There are several simple tools that can be used for technical analysis of cryptocurrency markets, including:
Moving Averages: This tool helps to identify trends by smoothing out fluctuations in the price data.
Relative Strength Index (RSI): This indicator compares the magnitude of recent gains to recent losses in order to determine overbought or oversold conditions.
Bollinger Bands: This tool plots a set of lines two standard deviations away from a simple moving average, which can help to identify potential buy or sell opportunities.
Candlestick charts: This type of chart provides a visual representation of price action, including the open, high, low, and close prices for a specific time period.
Fibonacci Retracement: This tool uses horizontal lines to indicate areas where the price may experience support or resistance.
It's important to note that these tools are not foolproof and it's always good to use multiple tools to get a better idea of what's happening in the market. Additionally, its always better to consult multiple sources and experts in the field.
A Simple Trading Example Using Technical Analysis Tool:
Here is a simple example of using a technical tool for trading cryptocurrency:
Let's say you are considering buying Bitcoin (BTC) and you want to use the moving average tool to help you make a decision.
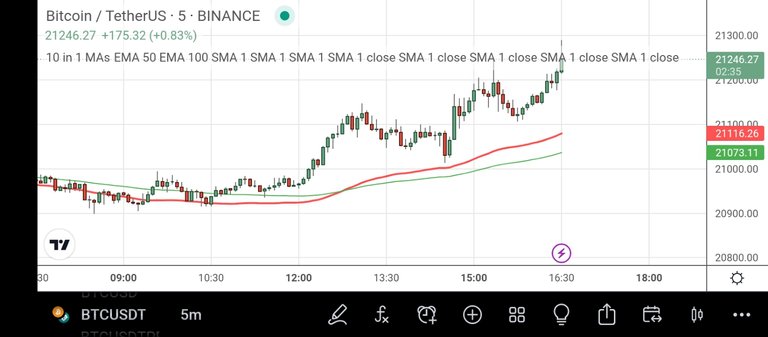
You plot the 50-day moving average (MA) on a candlestick chart of BTC.
When the short-term price of BTC crosses above the 50-day MA, you interpret this as a bullish signal and decide to buy BTC at the current market price.
As the price of BTC continues to rise, you notice that it has crossed above the 100-day MA, which confirms the bullish trend.
As a trader, you then decide to set a stop-loss order at the 50-day MA, to protect yourself from a potential price decline.
As the price of BTC continues to rise and reaches your profit target, you decide to sell your position and lock in your profits.
This is just one example of how technical analysis can be used in trading cryptocurrency. It's important to note that this strategy is not foolproof and that past performance is not indicative of future results. Additionally, it's always good to consult multiple sources and experts in the field before making any trading decisions.
If you like the post please don't hesitate to comment, vote and promote.

Posted Using LeoFinance Beta
Posted Using LeoFinance Beta