Good day Hiveians!
Join me in analyzing the crypto markets!
It's been a week since the last update on BTC
Not too much has happened since then in terms of price, but the additional time that has passed has made the original scenario in my view much more likely. Just to recap: until the crash to 30k I thought that bitcoin was in the late phase of the bull market and that we would see 100-200k in the coming months. Before the "Musk Rally", however, I argued actually for this scenario that I am again proposing. The main idea is seen in the two charts below:
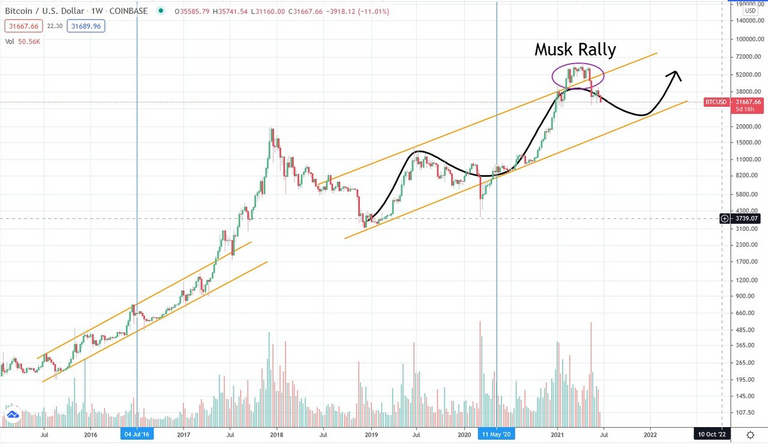
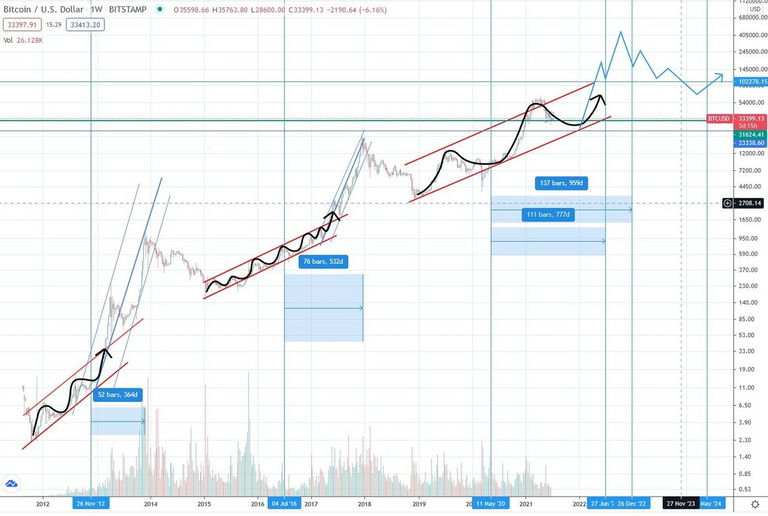
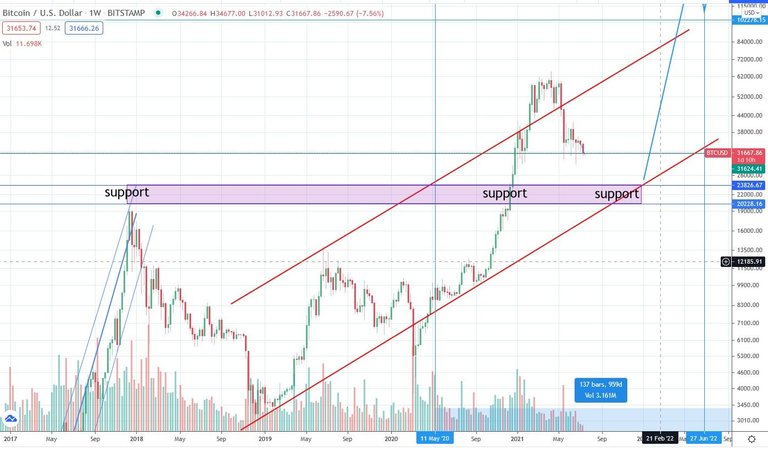
The main thesis is once again that the market top has shifted to 2022. It makes sense from a time perspective when comparing the past peaks in relation to the halving events.
Another week of sideways movement and a crucial rejection of key trend lines as well as the bearish outlook from several indicators has made a correction to 20k all but confirmed in my opinion. Let's dive into the charts:
The macro correction should look something like this:
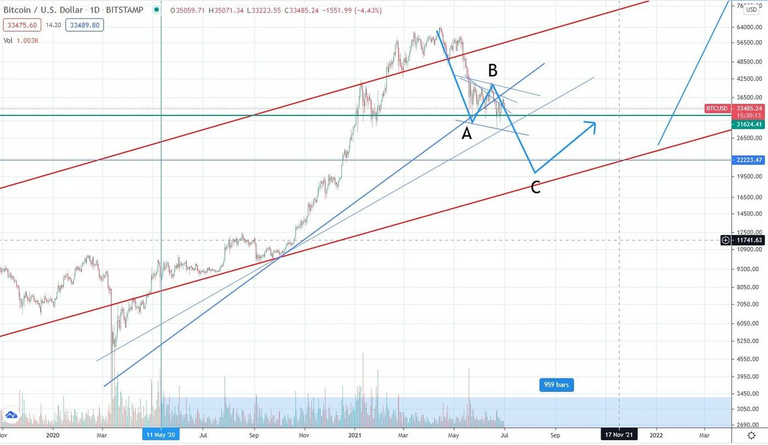
The "C" is supported by several factors which I will explain later on more detailed. But the one seen in the chart is the support line from the main channel seen in all previous bull markets (2nd chart). There are several main factors for the bear scenario (but keep in mind that we are still in a bull market overall!)
- A key trend line seen here in blue has been breached and acted as a resistance in the last weeks.
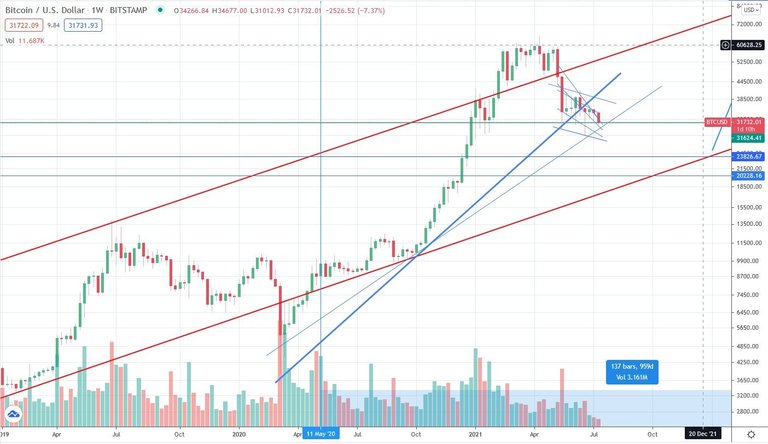
- A "death cross" occurred several weeks ago (yellow and blue lines crossing)
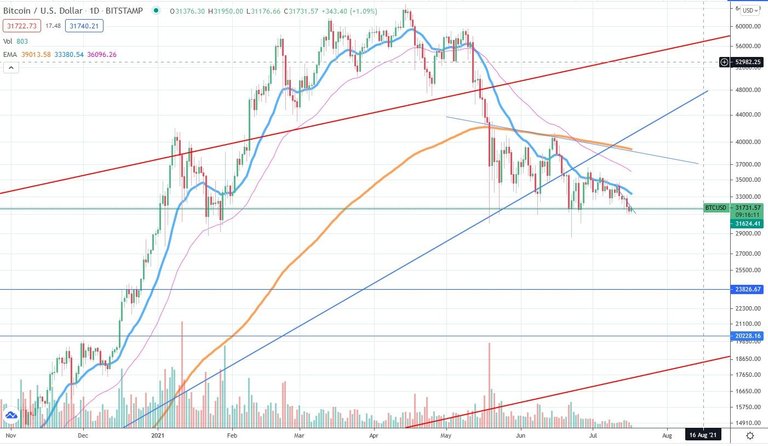
- A pretty much confirmed head and shoulders pattern (the confirmation lies in the rejection of the key trend line seen here again)
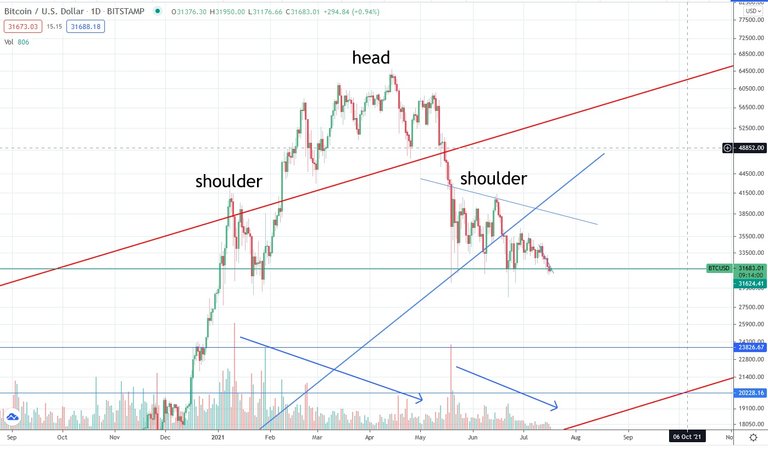
- Super low volume which has pretty much always preceded big crashes. It's seen in the blue arrow in the chart above.
All of these factors support a further correction of about 20-40% to about 20-23k. The support line is very strong at these levels. It comes from three parts: The first being the former high of the 2017 peak. The second one is a support from a sideways movement from the strong impulse wave in late 2020. And the third is the before mentioned support line which is the main channel leading up to the late phase of the bull market.
As a general reminder: Please keep in mind that none of this is official investment advice! Crypto trading entails a great deal of risk; never spend money that you can't afford to lose!


Check out the Love The Clouds Community if you share the love for clouds!
Everybody is envisaging the Head and shoulder pattern...it would not be weird to get the opposite 😂
The majority is never right, thus it can happen.
Posted Using LeoFinance Beta
true! but in combo with the other indicators and trend lines it's still a strong case for the bigger correction
i think 27k personally.
I agree...
Why am I Waiting 50% Loss in BTC Price?
Posted Using LeoFinance Beta
Yesterday I read someone's comment somewhere on the Internet, he was saying how more the time passes more this looks like a failed head and shoulder. And after a bit of reflection on it I kinda agree with him, if you think about it everyone was waiting 100k as something sure, almost written on the chart 🤣 And maybe because of this exact reason it never went to 100k! Now everyone is saying H&S since months and the bearish trend is becoming normality (and I believe we already had 2 paradigms shifts and people don't really know what is going on at the moment) 😄 20k is almost as sure as it was 100k, is it tho? The price has been trading in this range for almost 3 months now
Just my 2 cents 😄
Great post and brilliant analysis as always.
I thought about this as well and indeed the market is a reflection of human psychology so it is always a possibility. But I don't think the H&S pattern failed. In fact as I highlighted in the post it was rather confirmed by the rejection of the former support seen here
I remain "optimistic" about this rejection due to the other factors ;) but yeah, at the end of the day nobody knows (except if you name is Elon maybe)
I thought about this as well and indeed the market is a reflection of human psychology so it is always a possibility. But I don't think the H&S pattern failed. In fact as I highlighted in the post it was confirmed by the rejection of the former support seen here
Do you see the BTC dominance going down with the price or alts replicating BTC's action?
Posted Using LeoFinance Beta
alts pretty much always correct higher than btc, about 10-40% more. Alts also only gain over BTC when it is trading sideways in an upward impulse wave. Ss BTC dominance should go higher as it corrects downward, but should lose dominance once the correction is over and sideways trading begins. When the whole market goes bullish again, it is first bitcoin that increases its dominance and then the "alt market" follows
Anyway, my 2 cents :)
Looks good, i think we only get 20k if we start trading daily candles below 29k. (your C wave) It still feels the same as in sept 2021 vs sentiment/funding etc.