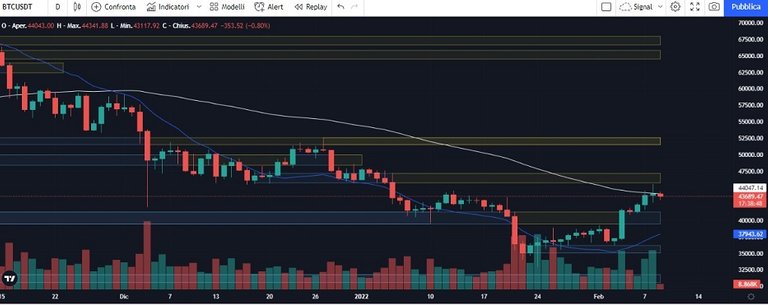
As you can see on the daily chart, after the crossing of the triple EMA at 50 and 200 occurred at the end of November and highlighted in my previous post, we had a descending trend of BTC. On February 4th there was a nice rise forming a bullish candle with even decent volumes. To have a change in trend, I would expect the breaking of the first resistance zone in the 47200 area. The figure that was created yesterday looks like a strong indecision between buyers and sellers.
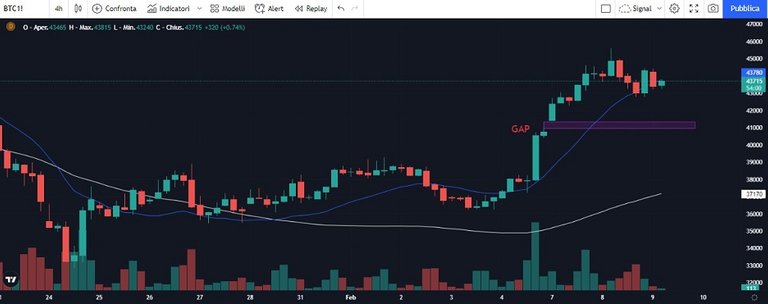
There is one thing that worries me, and it is the gap that was created on Monday with the Future CME. I enclose his 4-hour chart where the gap is highlighted, which until now has always been closed. If this were to happen, we must expect BTC in the 41200 area.
As usual, I am attaching the levels for a daily trading:
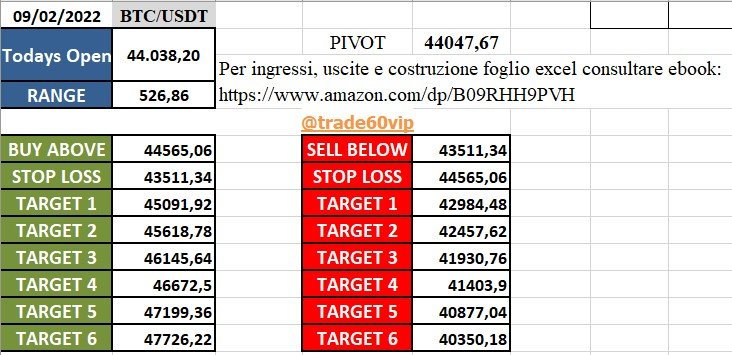
For the interpretation of the levels and the construction of the excel sheet that I always publish, and my trading method, you can consult the book in Italian and English: https://www.amazon.it/dp/B09QRXJCDQ https://www.amazon.com/dp/B09RHH9PVH
Log in to Publish0x:
https://www.publish0x.com/?a=oQeZ4DR6bp
Open an account with Kucoin use my code: https://www.kucoin.com/ucenter/signup?rcode=rJEUMUV
Open a Coinbase account to get bonuses 10$
https://www.coinbase.com/join/carote_7
This article does not contain investment advice. Every investment and trading move carries a risk, readers should conduct their own research when making a decision.
THE OPINIONS EXPRESSED BY THE AUTHOR ARE FOR INFORMATION PURPOSES ONLY AND DO NOT CONSTITUTE FINANCIAL, INVESTMENT OR OTHER ADVICE.
Graphic: tradingview.com
Posted Using LeoFinance Beta