a system that I created many years ago that has given me a lot of satisfaction and that I am now using with cryptocurrencies.
My trading method
After several years dedicated to trading, I decided to write this ebook to give others the opportunity to do this job in an almost automatic and profitable way.
I have really lost a lot of money in the past few years; then I realized that I had to use a system, a method that would allow me to limit losses and enhance profits.
A method that did not involve me psychologically, yes because, even if I consider myself an expert in technical analysis, my past failures were due solely and exclusively to a lack of discipline. This is why I will dedicate the first part of this book to you. In the second part we will see how to recover the data we need from the internet for free, and in the third I will illustrate my method.
DISCIPLINE
I think it is certain that in trading only a few people make money; have you ever wondered why? Maybe they have access to the best trading systems? Do they work intensely? Are they smarter than average? Are they excellent analysts? Do they handle stress better? Do they have access to confidential information?
From my experience and direct knowledge, I tell you: absolutely not! They are very normal people, their value is discipline.
There is only one crucial fixed point for successfully operating on the markets: reaching a mindset. A mental attitude that allows you to remain disciplined, focused and confident even in adverse market conditions.
Financial and emotional disaster is widespread because many of the perspectives, principles and attitudes that would make perfect sense in our daily life have a deleterious, if not the opposite, effect in the trading decision-making process.
We all know that there is no safe speculative operation: you invest by always thinking in terms of probability, not certainty. It must be remembered that every time you click to open a position, the possibility of losing money is always present
(we'll see how to make this to our advantage later).
But when you place an order, do you really realize you are taking a risk? Do you consciously accept the consequence of the lack of certainty, that is, the probability of a negative outcome of the operation? There is an abysmal difference between presuming to take a risk and consciously accepting to run it, in every operation carried out. If we feel emotional discomfort when we close a transaction at a loss, it means that this awareness has not occurred.
The real secret of success is the elimination of emotional distress!
Our greatest fear, after death and public humiliation, is that of losing money!
The stock market is neutral and does not generate errors; it communicates information to us about its movement and hands it to each of us in the exact same way, then each perceives and interprets this information according to their own experience and transforms them into actions to be performed. In a nutshell: the market is never wrong, we are the ones who interpret it incorrectly.
There is not a trader who has not entered a trade too early with respect to its trading signals, or too late, or exited a position for no reason, or due to a tip, or a rumor ... these are all errors generated from the market. They are just incorrect attitudes dictated by fear and greed, or by confusion.
The market very often presents contradictory situations: it can
do anything at any time.
Trading means operating in an environment where loss is unavoidable and requires absolute confidence in one's abilities. We must not try to avoid losses, we must try to beat the market by looking for repetitive patterns that can have a valid statistic over time.
Successful traders use very simple techniques, bordering on banal, so much so that they are doubted; yet they are successful, and by success is meant to be profitable.
An operation closed at a loss represents for us a cost that we must bear to avoid larger losses, closing a trade in stop-loss means, for us, using a winning strategy.
The term "hope" does not have to exist in our vocabulary.
We must learn to cut losses when our hypothesis turns out to be wrong, without the need to seek an alibi for the loss-making operation.
Here is the secret: to be rigid in our rules and flexible with our expectations.
And I repeat: it is important to consider losses as the cost of establishing winning trades.
METHOD AND DISCIPLINE!
RETRIEVE DATA
The first thing we need to build our own method is to find all the data we need.
To do this we will naturally use the internet; what we need is a site, where we can download the data, that is: opening, maximum, minimum and closing price of any security or index. We can get these items from our broker, or we can use www.prorealtime.com.
This site, through a free registration, provides the daily data of the main world markets; allows you to open charts, customize them; create lists of titles. And all in simple trading-system language.
For part of our activity, which we will see later, we will also need to have graphs to build with smaller intervals than daily ones, for example hourly.
Our broker will certainly give us this possibility by opening an account with a small deposit, even without handling, we have intraday charts available, without paying stamps and commissions.
Once we have collected the data we need, we need to build a very simple Excel sheet. We will now deal with the strategy.
STRATEGY
We must first of all have a goal.
What we want to achieve must be easily achievable and measurable, so it must be realistic.
Each of us will have a different goal based on the available start-up capital. Speaking of the latter, it is better to specify immediately that it must be capital that we do not need for the newspaper, but made available for the operations we are going to carry out.
The goal is to achieve a weekly compensation by speculating on the stock markets.
There are three key milestones to trade successfully:
DIRECTIONALITY
SUPPORT AND RESISTANCE
TURNING POINTS
Directionality: the term refers to the market, it implies the direction of our operations. If the direction is on we must be long, ie buy. If the direction is down we have to be short, that is, to sell.
How do we define the trend, the direction? We use a simple function that we will call "flat". It is a simple calculation of a point or price similar to a moving average.
We are interested in obtaining the flat referring to a weekly period. To do this we need to add the maximum price, the minimum price and the closing price of the previous week, of a stock, index or currency and divide it by 3.
Example on the Nasdaq 100:
Week between March 9, 2009 and March 13, 2009; maximum price 1,170.48 minimum price 1,040.41 closing price 1,168.52.
We will then have 1,170.48 + 1,040.41 + 1,168.52 = 3,379.41
We divide this total by 3 and we get: 1,126.47, our flat on the nasdaq 100.
On the chart for the current week, we do nothing but draw a straight line on this level for the following week; as shown in the following figure.
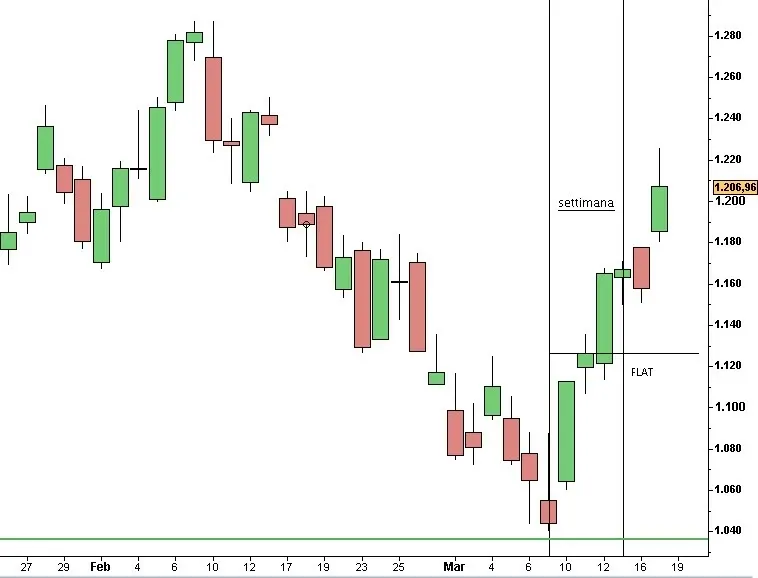
At this point we have to calculate the weekly range, that is the maximum minus the minimum, more precisely 1.170.48-1.040.41 which is equal to 130.07. Later we will calculate 50% of this data (130.07 / 2 = 65.04) and by adding and subtracting it from the flat value we will respectively obtain the first resistance and support line that we will always draw on the following week. We will do the same thing by calculating 61.8% of the range, thus obtaining the second line of resistance and support as indicated in the following figure.
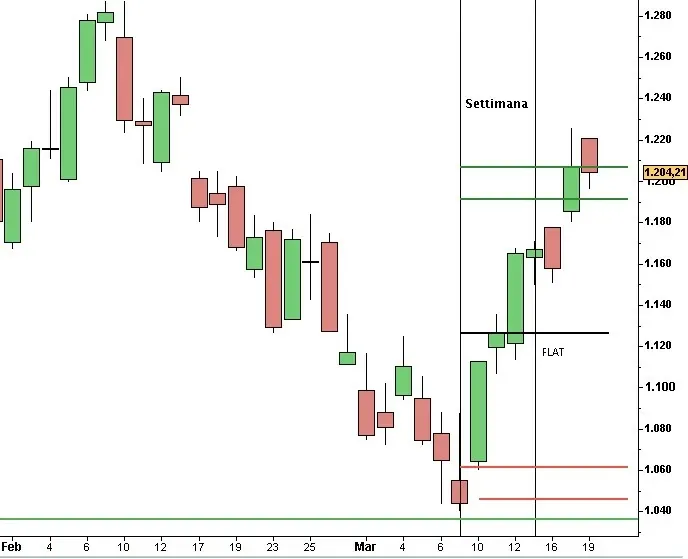
The first area of the resistance has the lines colored in green, that of the support colored in red. We will do the same thing by adding and subtracting 100% and 138.2% of the range from the flat. This last area will represent the second area of resistance and support. Let's see how to interpret directionality.
If on the Monday following the previous week, the opening price is higher than the flat price, we will have a purchase transaction, vice versa for sale. Now that we have defined and built the directionality and the supports and resistances, we just have to look for the turning points, or when to enter the market? We need to find a pattern, a figure that allows us to enter long or short. Obviously, to also have intraday operations we will work with hourly or 30-minute charts and we will look for only three patterns: hammer, hanging man and inside. To do this we need a little notion of the graphic representation of Japanese candlesticks.

It is a graphic representation that gives us an immediate view of the maximum, minimum, opening and closing price of any time horizon. If the closure is greater than the opening, the body is white, on the contrary black.
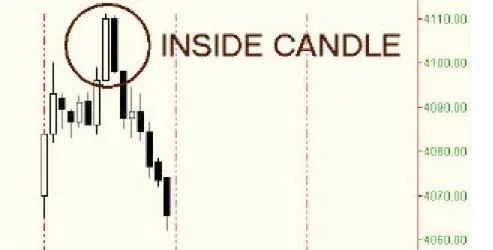
The INSIDE figure; is a candle whose maximum and minimum are respectively lower than the previous candle. If it is realized on a resistance zone it sells at the break of the minimum and the stop is placed on the high of the previous candle. The reverse if it is formed in a support area.
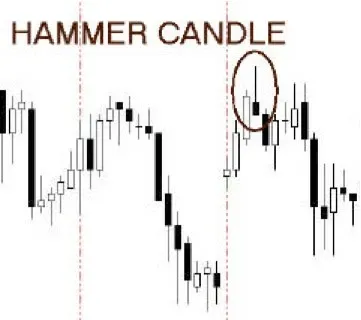
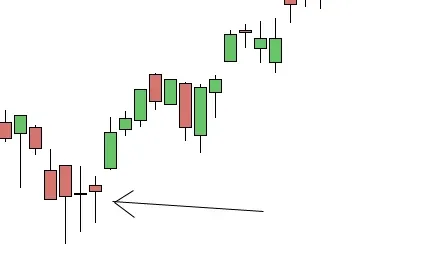
Even in the case of hanging (hammer), if it occurs in a resistance area, it sells when its minimum is broken. With stop on its maximum. This figure can also occur in a support area; it is completely mirrored to the other, representing a small body at the top and a very large shadow below. In this case, you buy at the break of its maximum with a stop on the minimum.
We are now able to decide the entry of the operation; obviously we can choose our type of operation based on our temporal needs. What I use the most is precisely the calculation made on a weekly basis by looking for the entry points with an hourly candlestick chart (each candle instead of representing a day is built on an hour). I really want to reiterate once again, that we will enter into position only and exclusively when the signal occurs near the support or resistance areas. Don't dream of being able to predict the market! This is impossible, let's always stick to the method and discipline. Let's now look at a practical example.
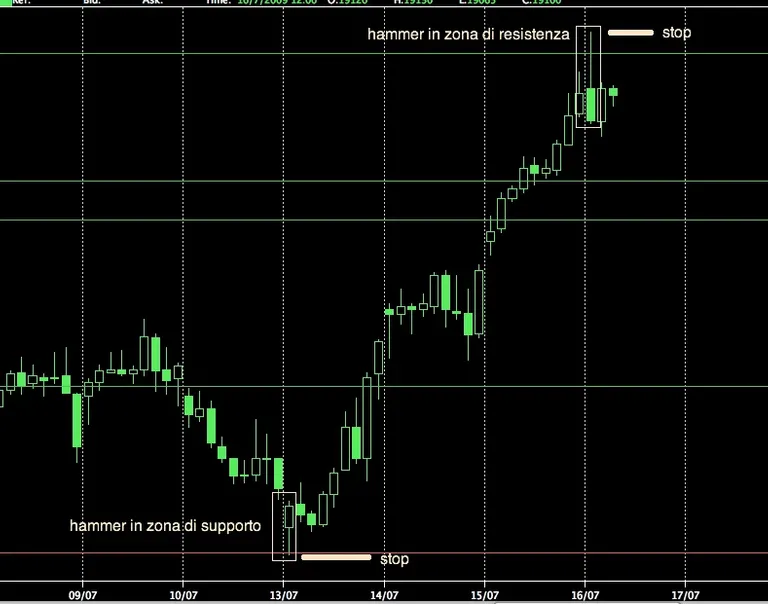
This hourly chart shows our FIB up to the morning of 16/07/2009 (when I am writing this part). Taking into consideration the previous week, that is the one that goes from 06/07 to 10/07, we had a maximum at 18.870, a minimum at 17.810 and a closing at 17.840; going to calculate the points that interest us, we get the following results:
Flat 18.173 R1 18.703 R2 18.828 R3 19.233 R4 19.638
S1 17.643 S2 17.518 S3 17.113 S4 16.708
We draw these lines on the chart and expect the pattern we are looking for to occur from Monday 13/07. On Monday 13th in the first hour there is a bullish hammer in the first support zone whose maximum is 17,800; which is why we go to purchase in the hour following it. We enter long at 17.810 with a stop below the low of the hammer 17.635 (I usually put the stop a little lower, in this case 17.620 to avoid stop hunters). As no other closing pattern occurs, I still hold the position open. On day 14 everything takes place in the neutral area without our sign of inversion, so on day 15 I hopefully await the achievement of a first resistance and since I have to work calmly and without anxiety I decide to put a stop that in the meantime has become a profit under the previous day's low at 18,250. On day 16 (ie today) a bearish hammer is formed after the first hour of trading, so I close the position below its minimum at 19,000 points, earning 1,190 points and simultaneously open another bearish one with a stop on the maximum at 19,300. As you can see it is a simple type of operation, without stress and allows you to not always be glued to a monitor.
The next step is to build the excel sheet that automatically gives us the values we are looking for.
First of all, let's open our blank sheet and enter the data like this:
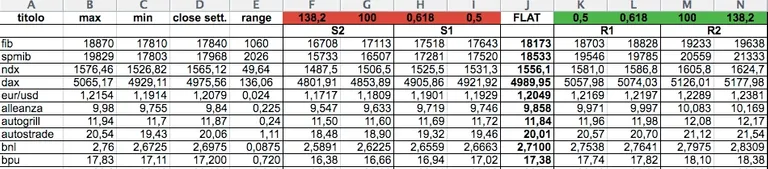
in the first column we insert the titles we want to follow; in the following, the maximum, the minimum and the closing of the week.
Then, as you can see in the figure, let's enter the formulas to calculate the values automatically.
For the FLAT the formula is: = (B3 + C3 + D3) / 3
For R1 = J3 + (E3 / 2)
For R2 = J3 + (E3 * 0.618)
For R3 = J3 + E3
For R4 = J3 + (E3 * 1.382)
For supports, the formulas are the same by changing the + sign with the - sign.
Happy trading everyone.
Mario Carotenuto
This article does not contain investment advice. Every investment and trading move carries a risk, readers should conduct their own research when making a decision.
THE OPINIONS EXPRESSED BY THE AUTHOR ARE FOR INFORMATION PURPOSES ONLY AND DO NOT CONSTITUTE FINANCIAL, INVESTMENT OR OTHERWISE ADVICE.
Posted Using LeoFinance Beta