Good evening investor friends!
Last March 16th we were analyzing the EUR/USD pair. We concluded that it needed to break above the strong resistance 1.20 in order to recover.
However, it is still unable to overcome this resistance, forming a double top at the 1.1990 level (red horizontal line). The bearish pressure grows with each failed breakout attempt.
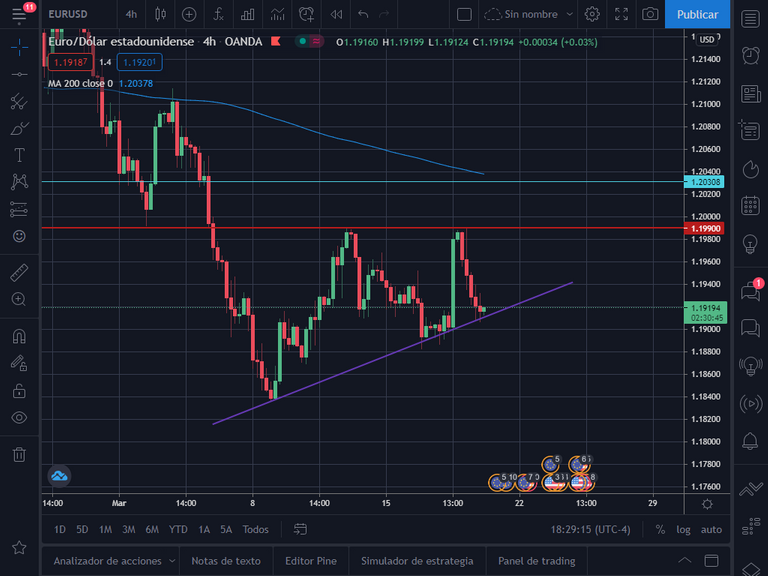
If it fails to break this resistance, the pair could be affected and fall below the uptrend line (purple line), and could quickly reach the level of 1.1840.
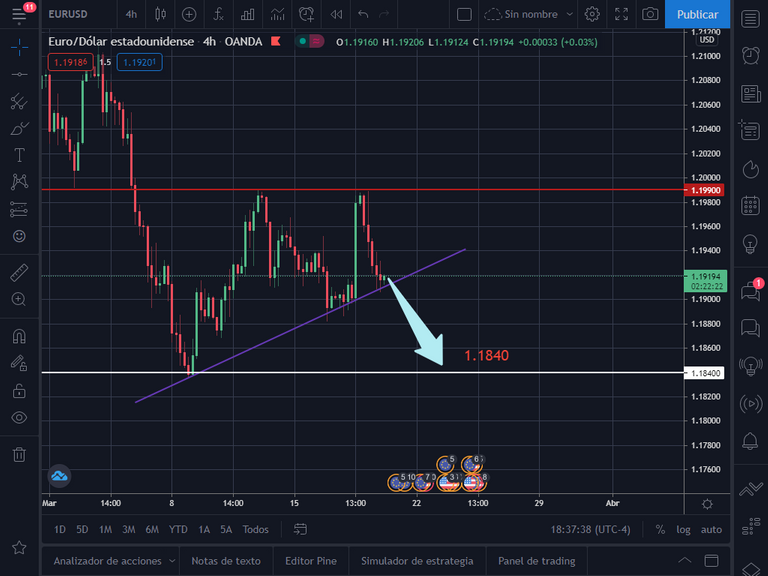
In my personal opinion we should remain bullish with take profit at 1.1990 and stop loss below the ascending line (purple line). In case of a downward breakout, sell with take profit at 1.1840.
Important
The information provided in this publication should not be considered as an investment recommendation. Trading cryptocurrencies, forex, stocks, among others, is risky.
Posted Using LeoFinance Beta
Congratulations @tradingworld! You have completed the following achievement on the Hive blockchain and have been rewarded with new badge(s) :
Your next target is to reach 50 replies.
You can view your badges on your board and compare yourself to others in the Ranking
If you no longer want to receive notifications, reply to this comment with the word
STOPWith EUR/USD breaking lower through daily support, my bias here remains to play from the short side.
Take a look at my daily zones here:
I think our trading styles are a little different in that I only take entries when price is closer to daily zones, so I actually like your idea of being bullish on the 4 hourly price action.
My only concern then becomes how you manage your risk on a long setup at these prices? Where would you place your stops?
Posted Using LeoFinance Beta
Thanks for commenting on my post my friend!
In answer to your question, I think my perspective would change in case of trading 1 day candles.
In 4 hours timeframe my entries would be with a higher leverage and looking for shorter duration trades. My stops in this case I put them as I mentioned in the analysis.
As for your daily candlestick analysis, my trading style would change. I would wait for price action near the 1.20 and 1.2040 top. I would prefer to trade a false breakout (entering to the downside) with stop above the 1.20 - 1.2040 ceiling and with lower leverage. And in case of a scenario where that ceiling is broken, I would wait for a pullback and enter to the upside with a stop below the now 1.20 support.
It is good to trade at higher time frames and at key support and resistance. The analysis tends to be more accurate.
PS: I saw your reply to my comment on your post today my friend, but I don't have enough credits to reply to you both hahaha. So I'm replying to you here.
It is a pleasure for me to do this work as it is my passion. I thank you for following me and it is a pleasure for me to be of benefit to you. My intention is to offer my help to this community and bring a lot of value to it. Greetings and a hug colleague! 🤗👋
Posted Using LeoFinance Beta