Today's post will be different.
It will be mostly pictorial, this is because of the present analysis.
The chart we will be using is from Coinbase, Weekly time frame and Heiken Ashi candles. We will be using the Time cycle tool to make some deductions(nothing is 100% accurate, worst still in an emotionally driven market).
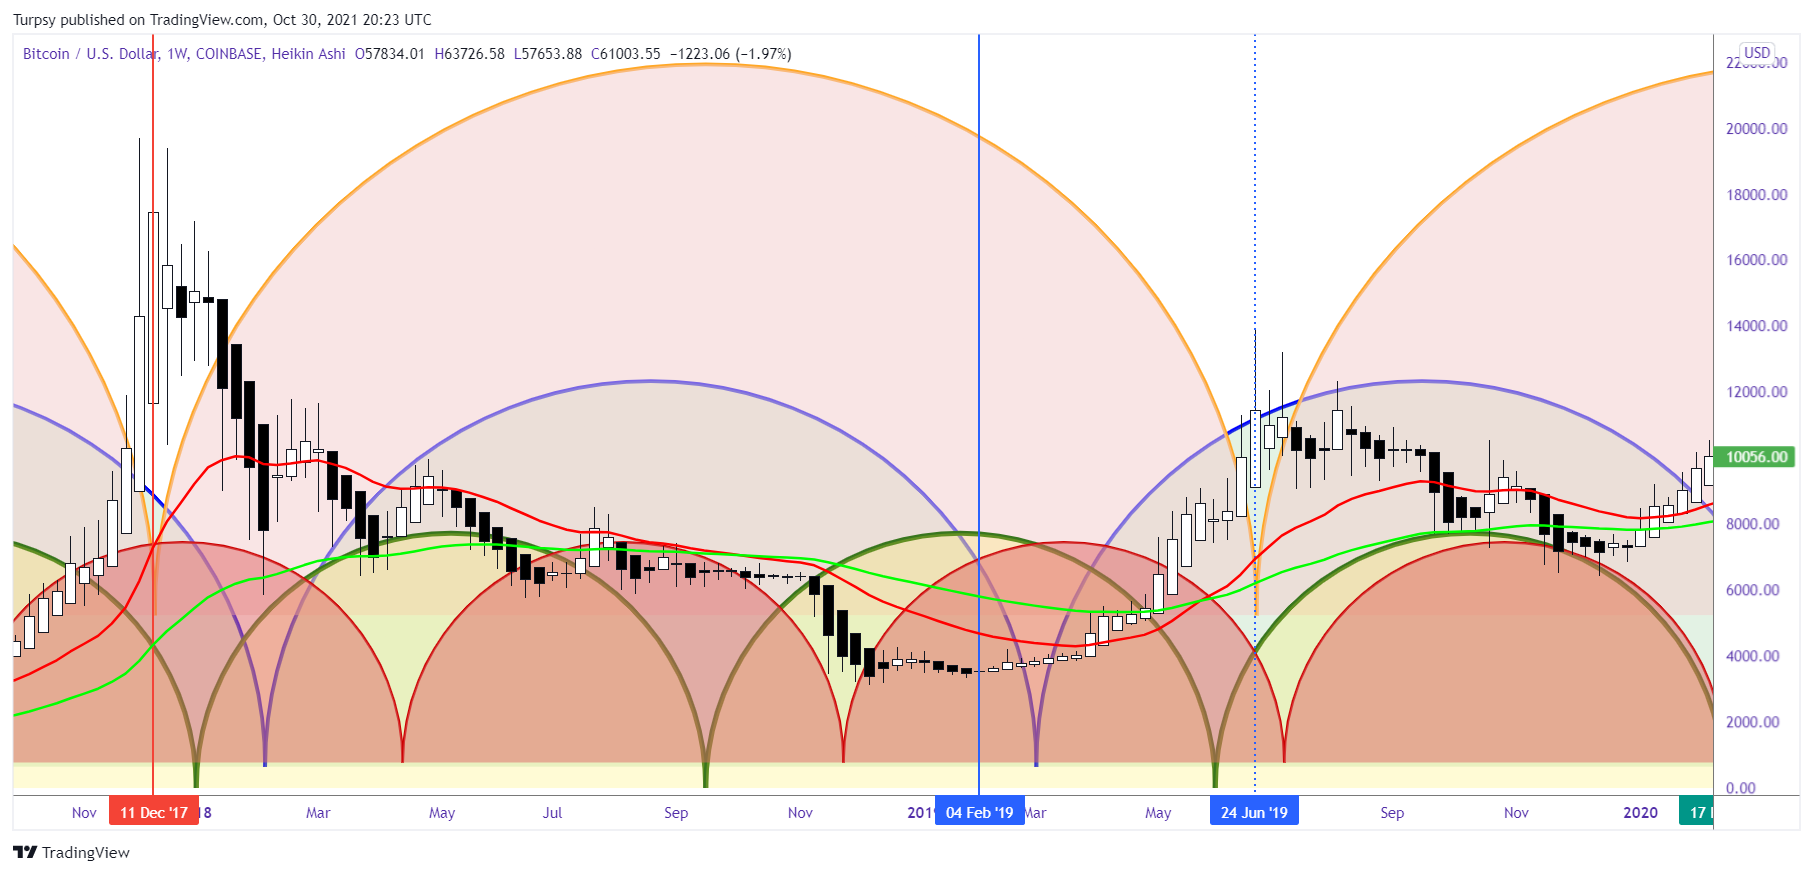
1. From 2014 to 2017, each time we are at the Trough (green vertical lines), we had a 100% chance of getting a good bargain: meaning we are buying at a lower price( [isn't that what we all want :)?] .
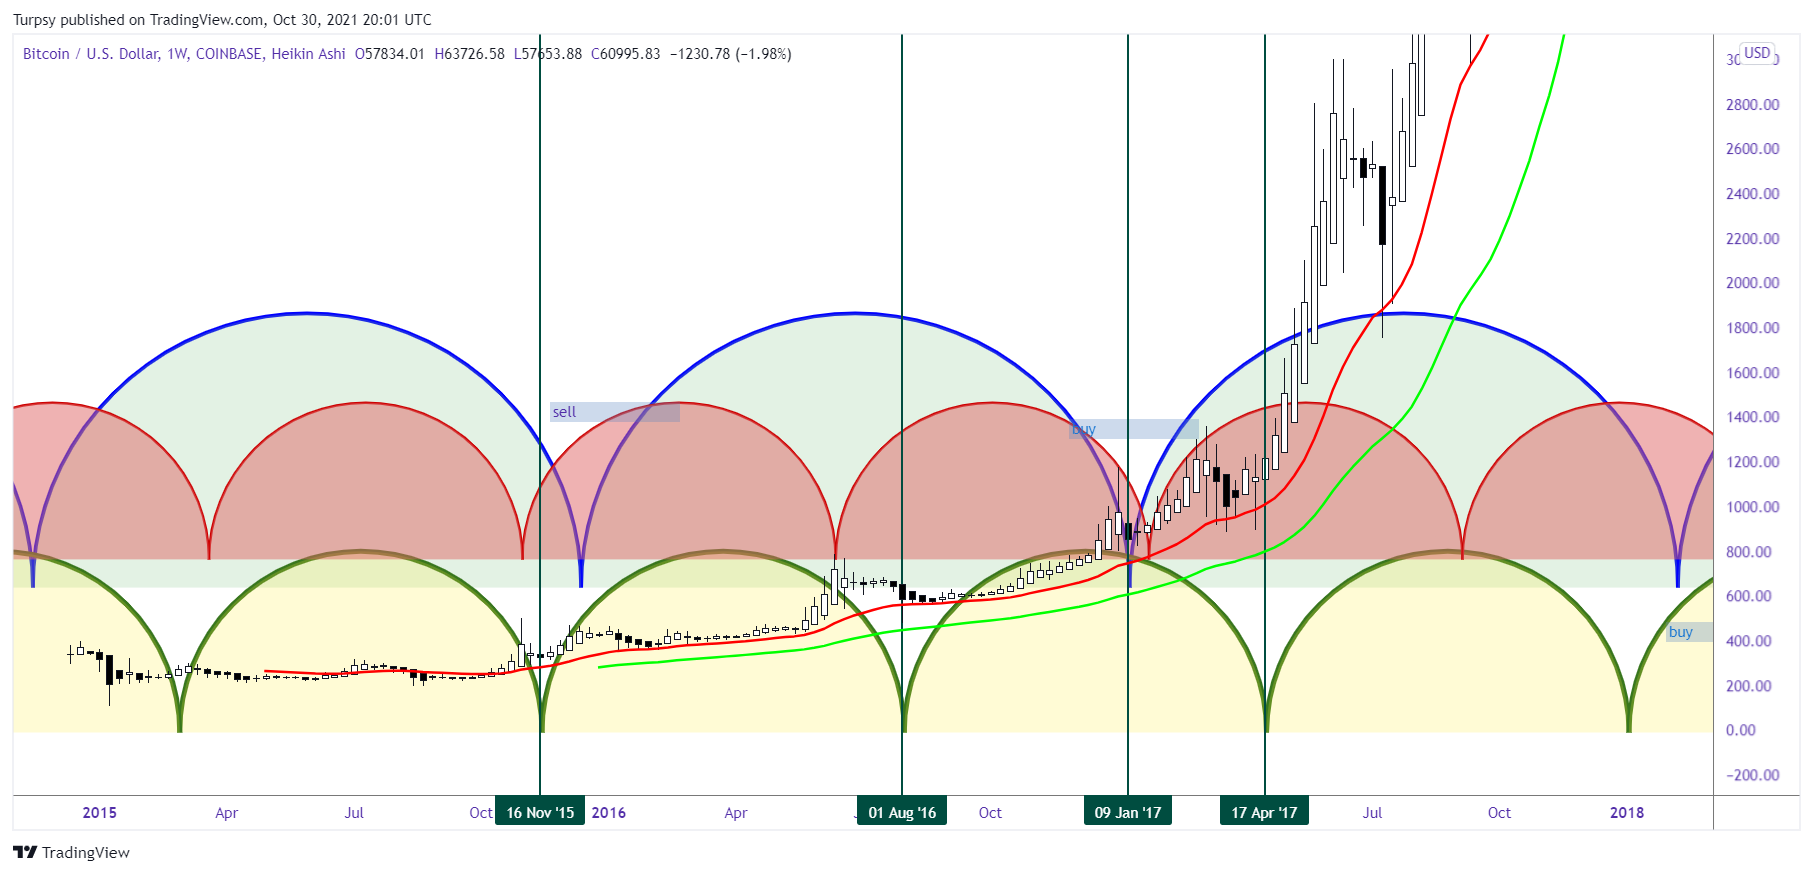
https://www.tradingview.com/x/MEZSIurN/
2. The all-time high in 2017, came at the trough of the bigger time cycle, I removed all the small-time cycles series to show this properly.
3. The intersection of the time cycles (blue vertical line), was actually the right time to buy.
https://www.tradingview.com/x/U4jVsrYf/
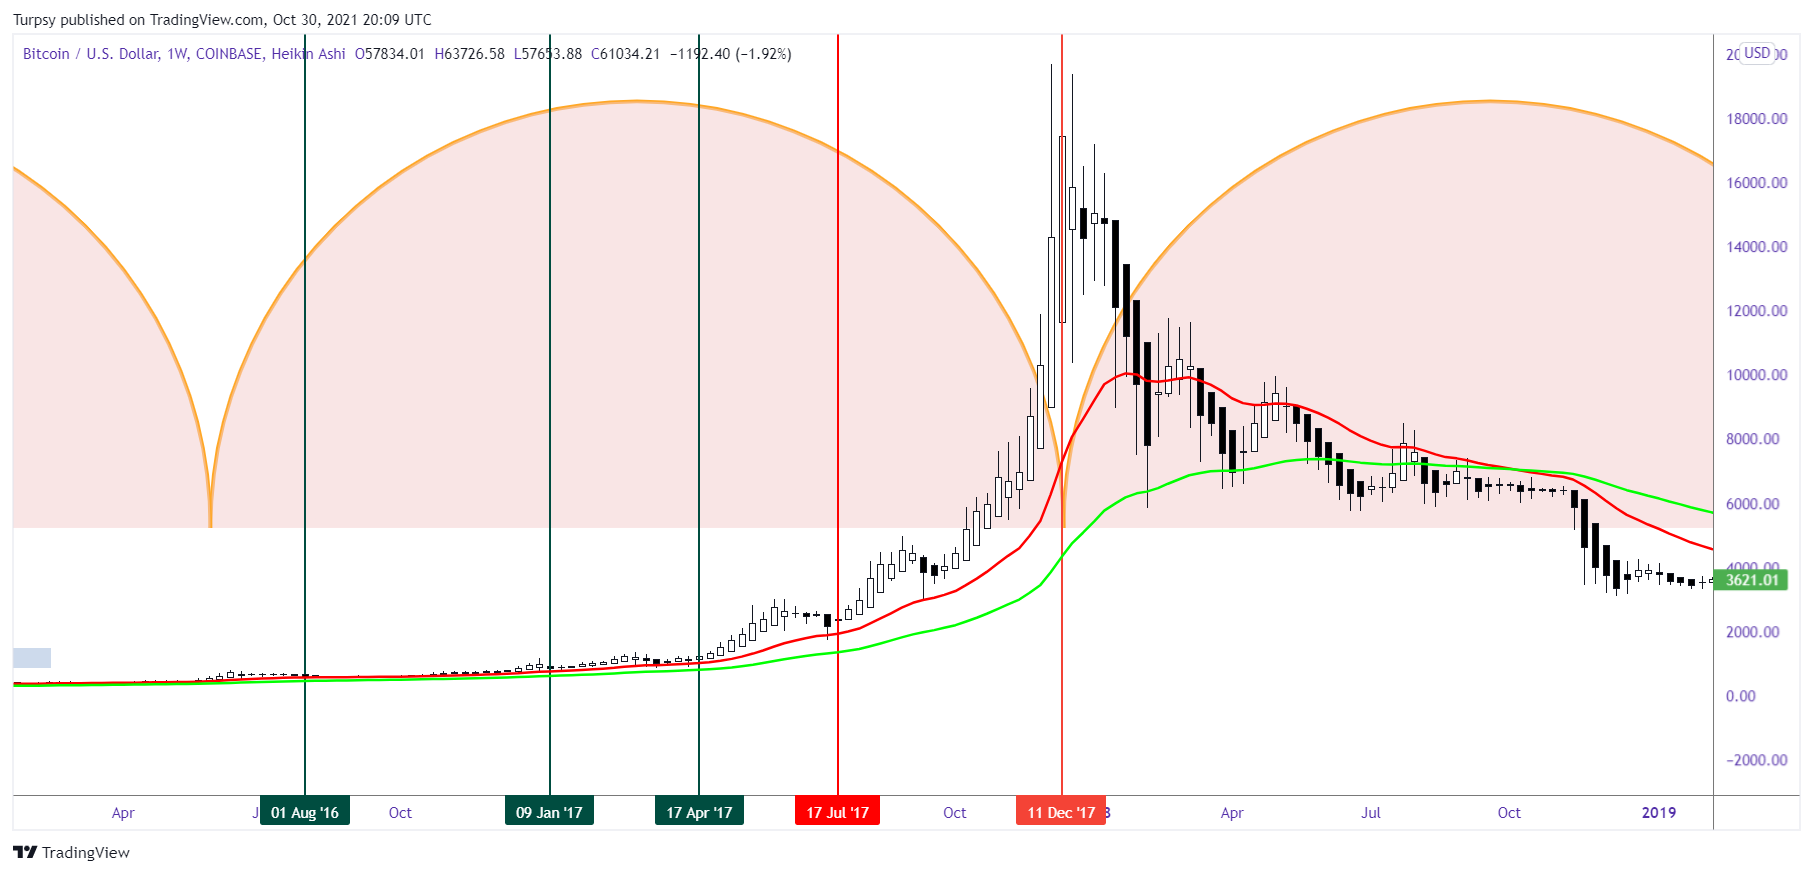
Once again, the high was at the trough of the big time cycle (dotted vertical line)
https://www.tradingview.com/x/v3rNpcHQ/
4. It is also important to state that, the trough of the blue ink time (March 2019) series could have been a good price to get in.
Also, in March 2020, the blue-ink Time cycle coincided with another low to buy
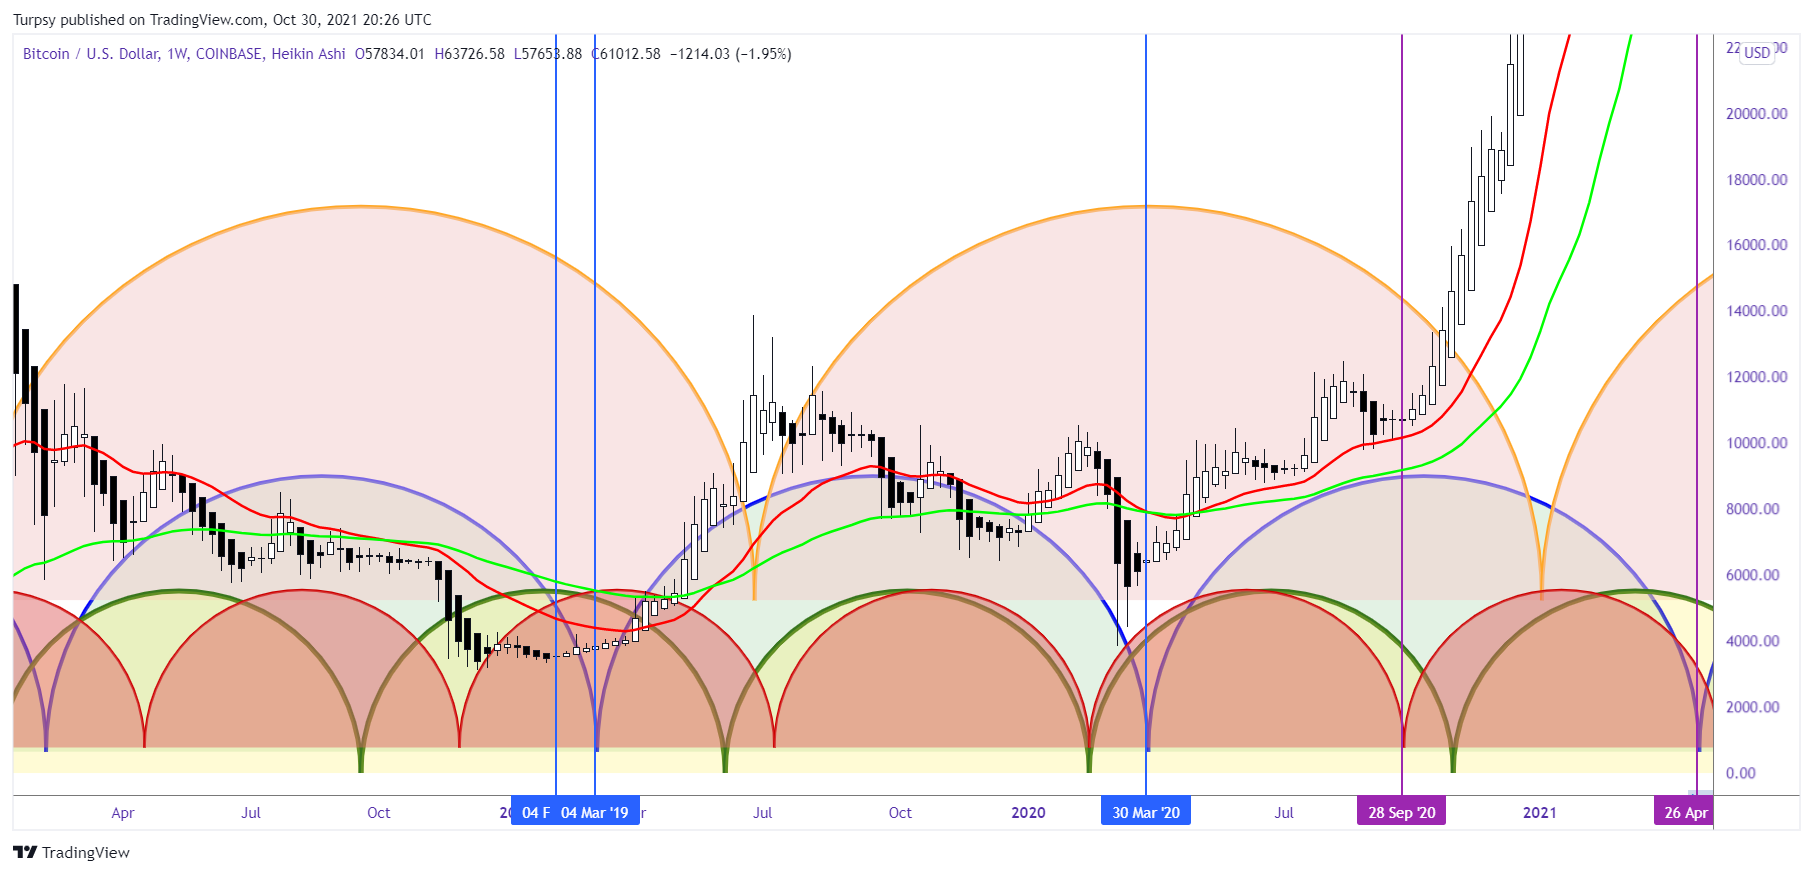
https://www.tradingview.com/x/v3rNpcHQ/
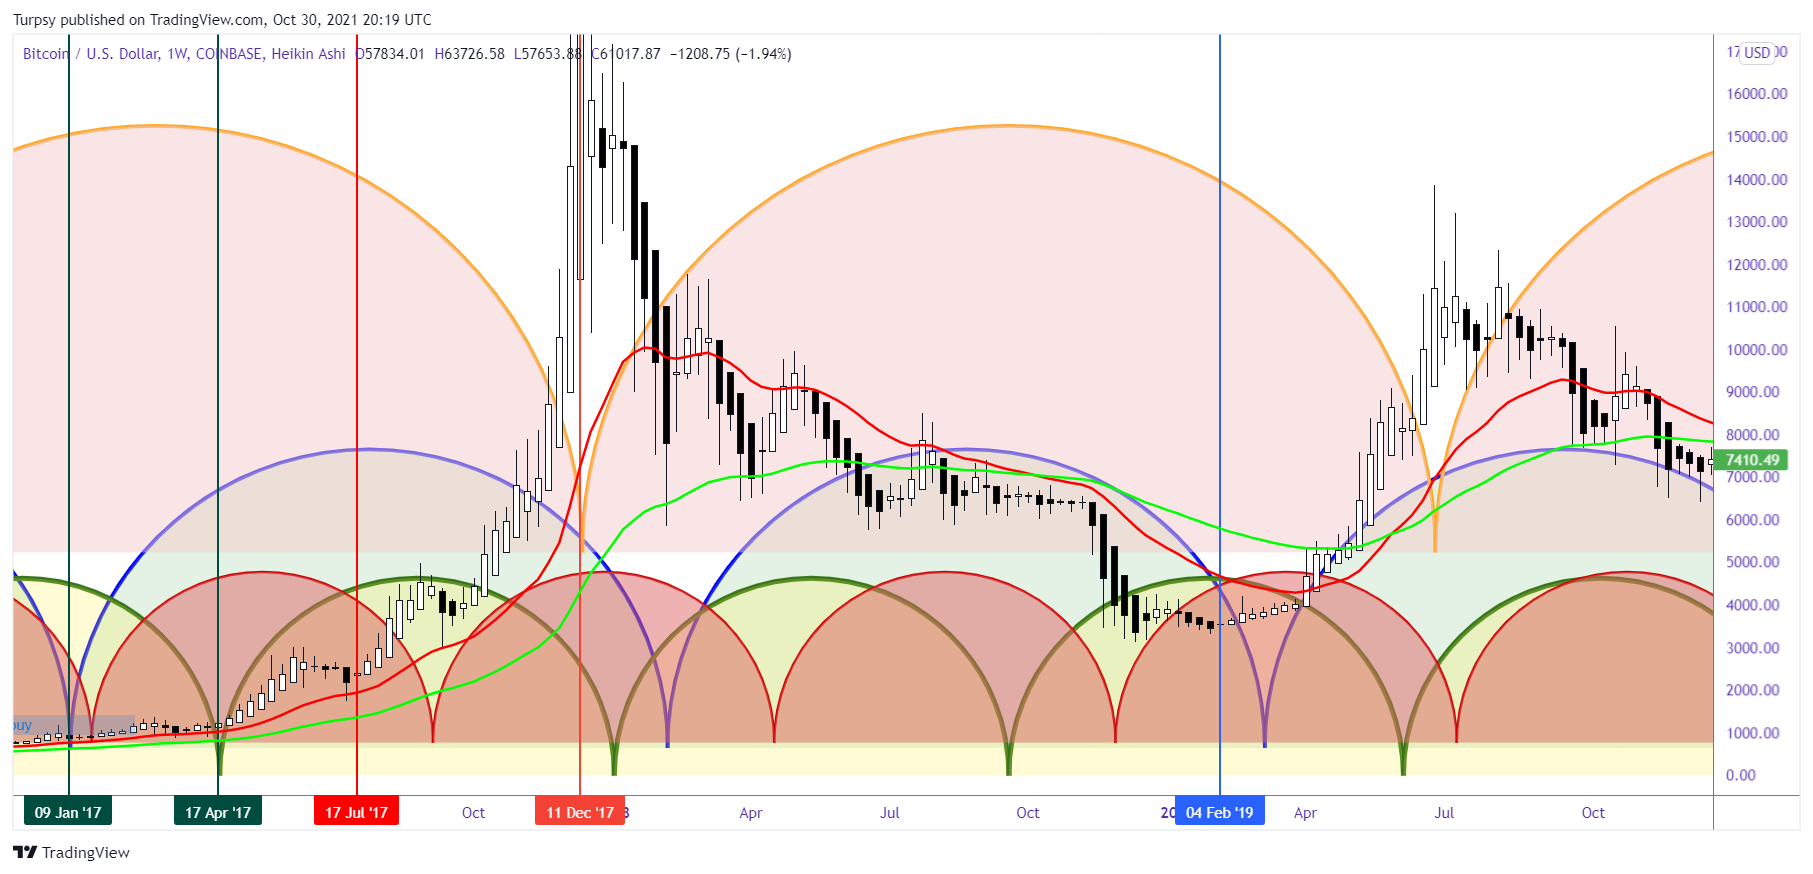
5. Like in the previous two troughs, the larger time cycle indicated a high. This time a high was also at that trough(first purple vertical line), however, the price moved to a new ATH thereafter (Second purple vertical line), which happens to be the intersection between the blue and red time cycle.
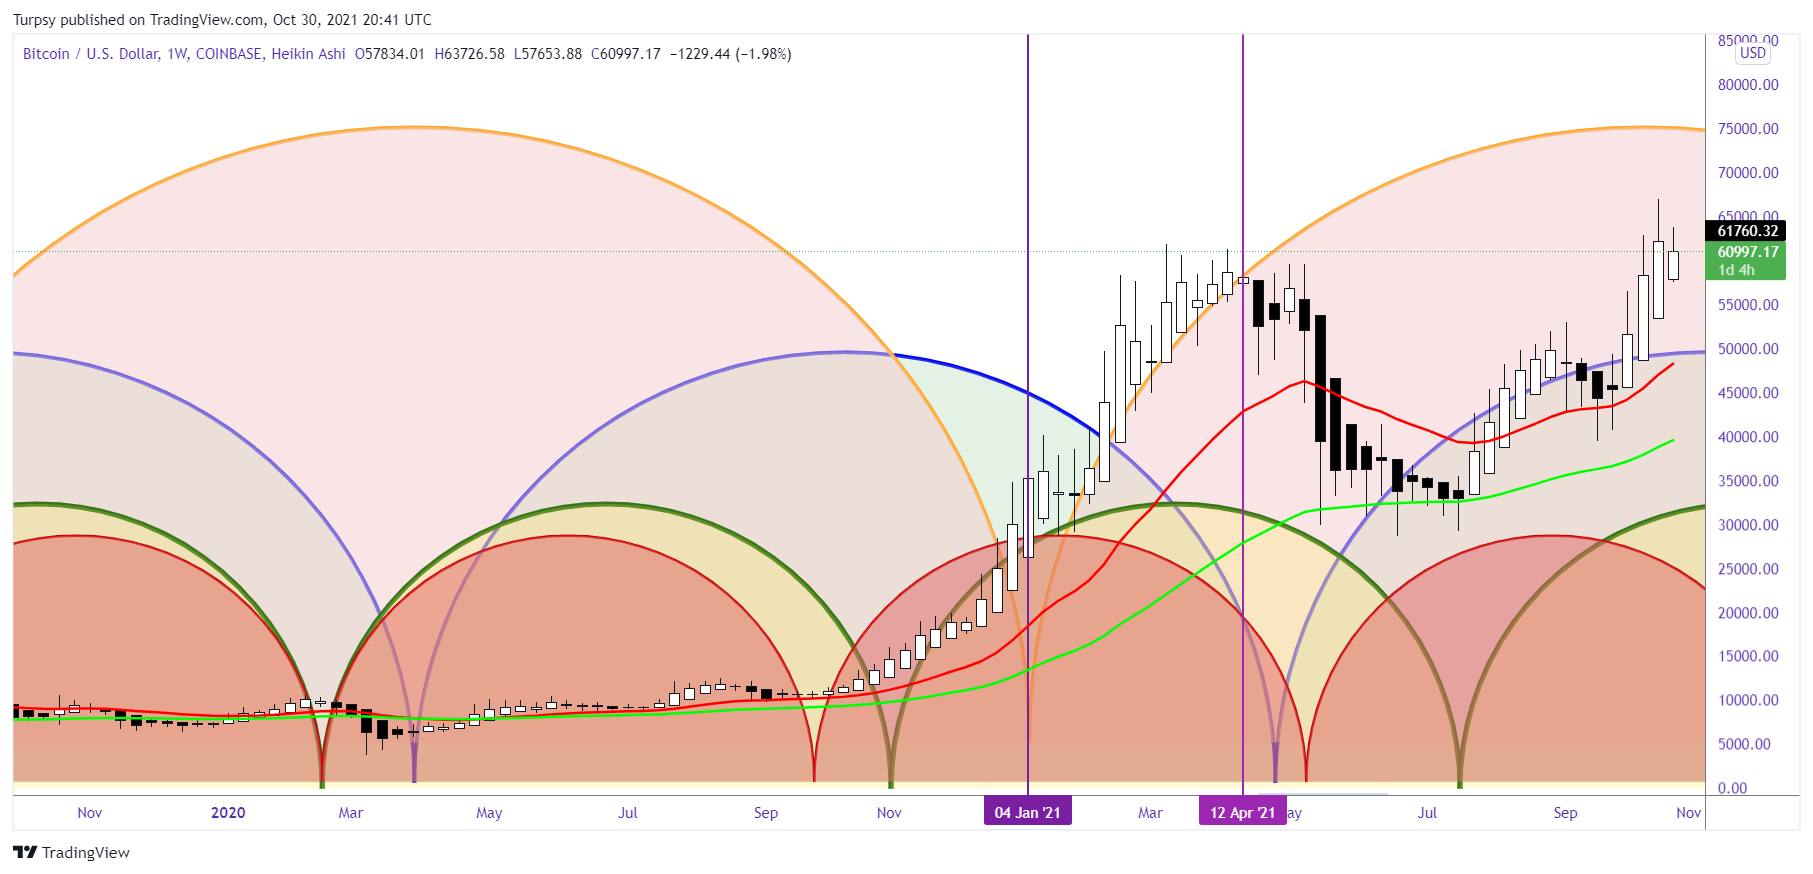
https://www.tradingview.com/x/v3rNpcHQ/
6: After that we saw that the trough at the green ink time cycles marked a low (first green vertical line). Also, the intersection between the green ink time cycle and red ink time cycle marked another low (second green vertical line), before the mark up phase.
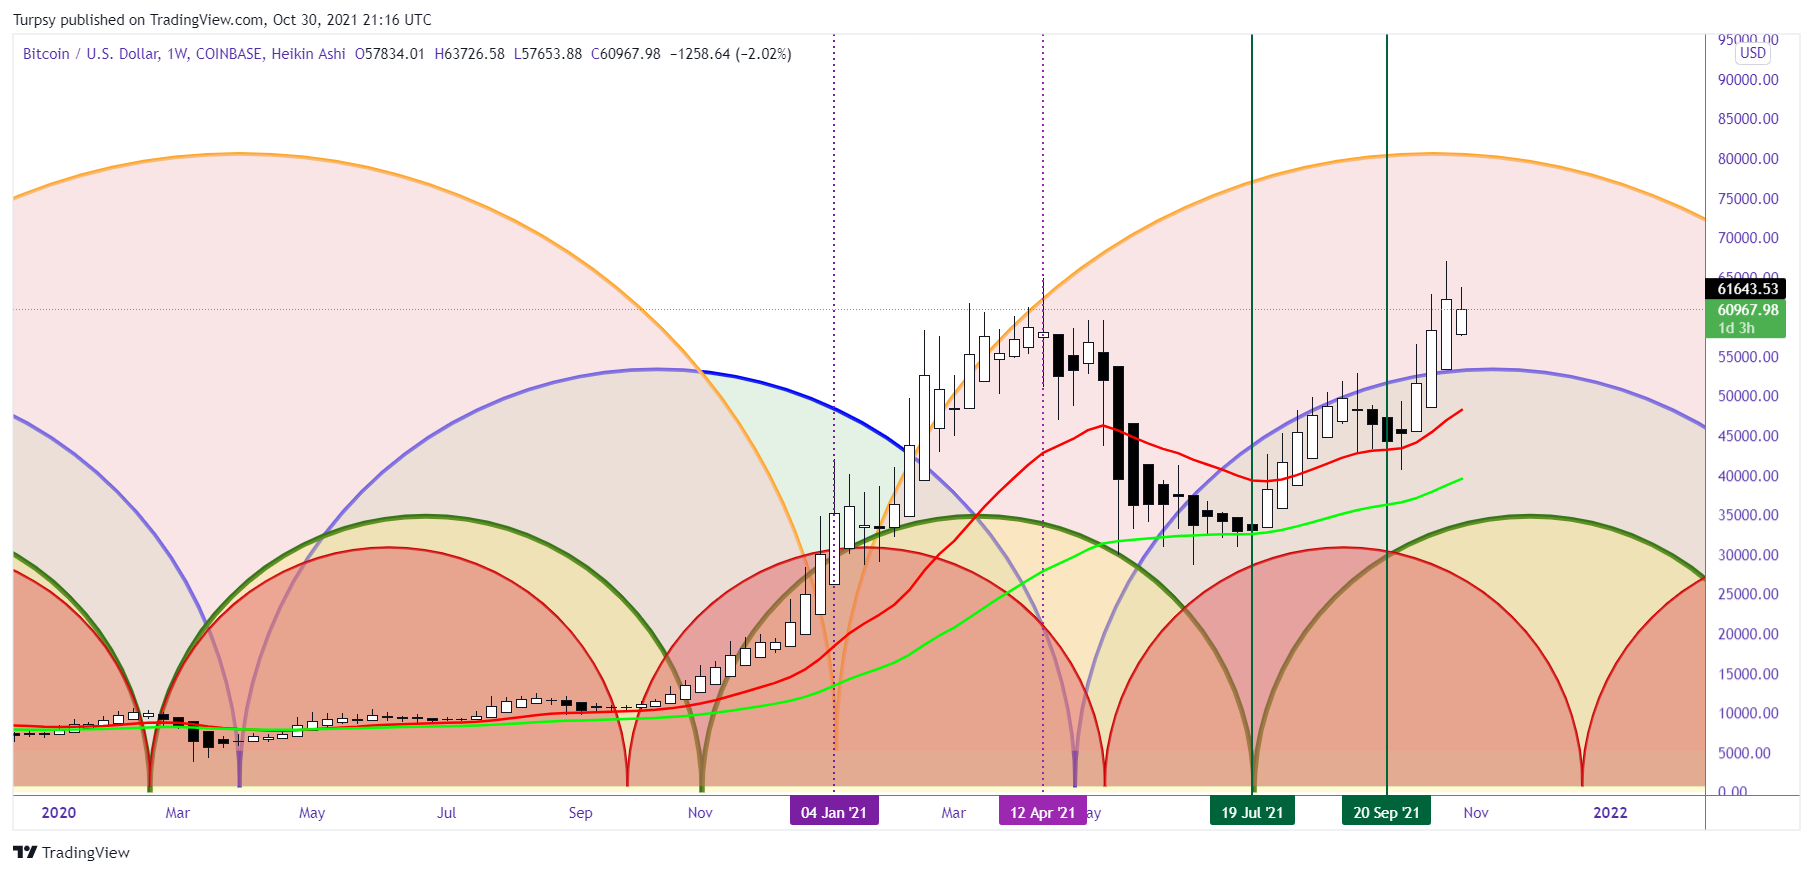
https://www.tradingview.com/x/v3rNpcHQ/
Notes:
It is difficult to make a concrete assertion on the price just by the trough or intersections.
It might be a good idea to start watching what price will do when we are close to a major intersection or trough.
The closest trough right now is at December 2021, which means, we should be watchful of what price might do at this time.
Based on the yellow ink top in the previous years, I can assume we might see a top in Bitcoin price in July 2022.
- It is important to note that we have an intersection in Feb 2022, trough of green ink time cycle at April 2022.
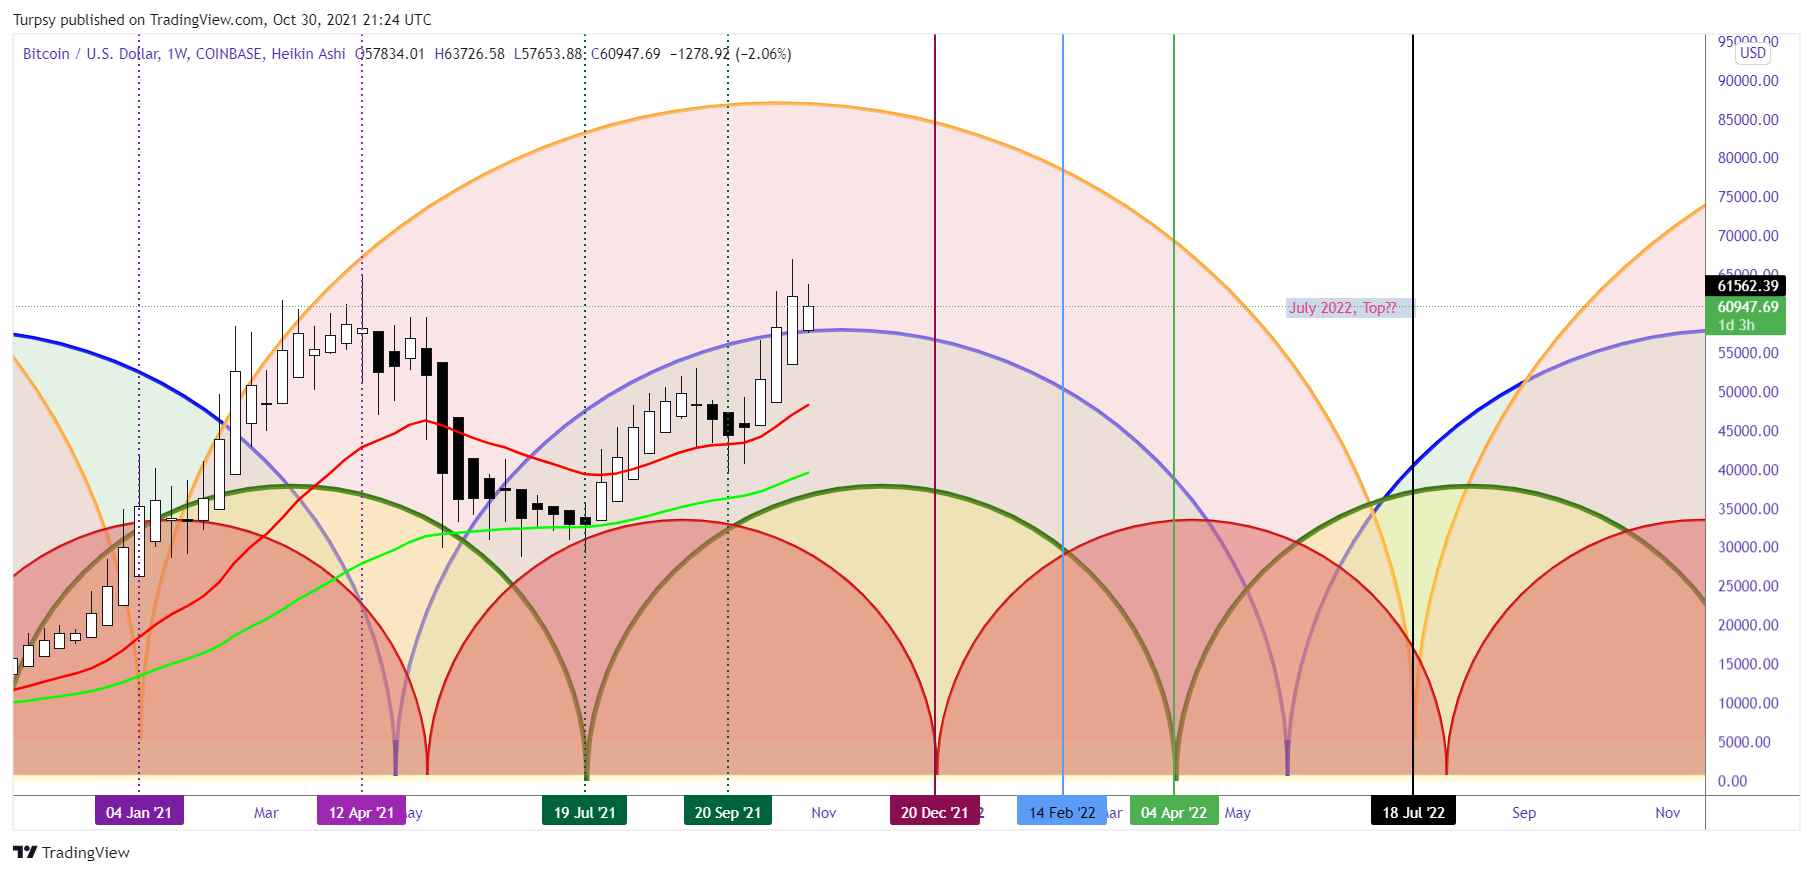
https://www.tradingview.com/x/uc1oDdMx/
TLDR: These are the dates we should be careful, Dec 20, 2021, Feb 14, 2022, April 4, 2022, July 10, 2022 (with a +/-1week).
We would revisit this post around those dates.
Have a pumped weekend.
Posted Using LeoFinance Beta