![]()
En este post semanal te explico mi interpretación del mercada de criptomonedas, principalmente Bitcoin. Podrás encontrar un análisis detallado de mis perspectivas, planificación y ideas para posibles operaciones.
- Análisis Técnico de los gráficos DIARIO, 4 HORAS, 1 HORA o 15 MMINUTOS
- Zonas de Interés.
- Posibles movimientos operables.
- Ideas y reflexiones sobre lo que espero para mi operativa durante las semanas.
- Mi plan de acción.
IMPORTANTE: Esto no es un intento de predicción o anticipación de los movimientos, sino una planificación objetiva para reaccionar a los posibles diferentes escenarios que puedan darse durante mi semana de trading y los comparto contigo esperando que te sean de utilidad. Recuerda que el trading es una actividad riesgosa donde puedes perder tu dinero así que ten mucho cuidado con las decisiones que tomas.
GRÁFICO DIARIO
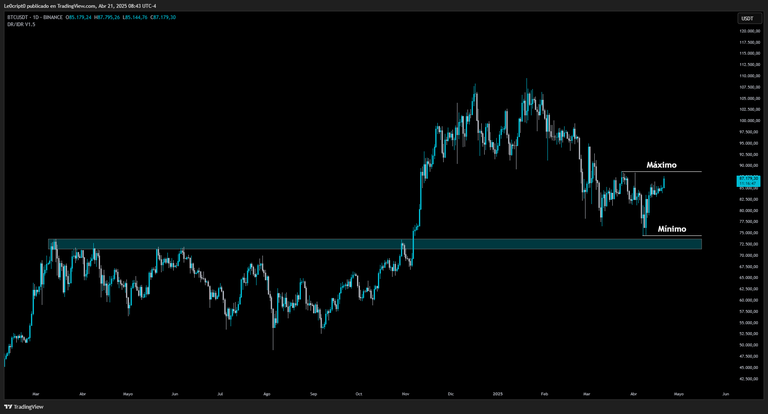
En GRÁFICO DIARIO poco ha cambiado desde el análisis de la semana pasada, la tendencia principal sigue siendo alcista y nos encontramos en un retroceso de dicha tendencia.
El precio se ha mantenido en la parte alta del rango y con la apertura de los mercados ayer domingo ha mostrado fuerza alcista con una subida de +5% entre ayer y hoy lo que podría ser un indicativo del comienzo de una semana alcista que nos lleve a recuperar los 90k
GRÁFICO DE 4 HORAS
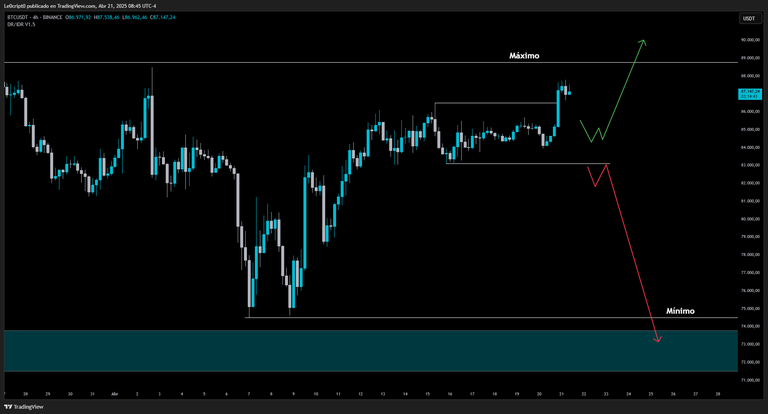
En H4 la acción del precio está algo más complicada de interpretar ya que se mantuvo en un rango bien corto durante todo el fin de semana y este fue roto al alza el domingo en la apertura del mercado asiático.
Aún así la zona en que nos encontramos sigue siendo idónea para buscar shorts si el precio comienza a mostrar debilidad. Importante en esta zona decisiva tener siempre el Stop Loss bien colocado.
GRÁFICO DE 1 HORA/15 MINUTOS
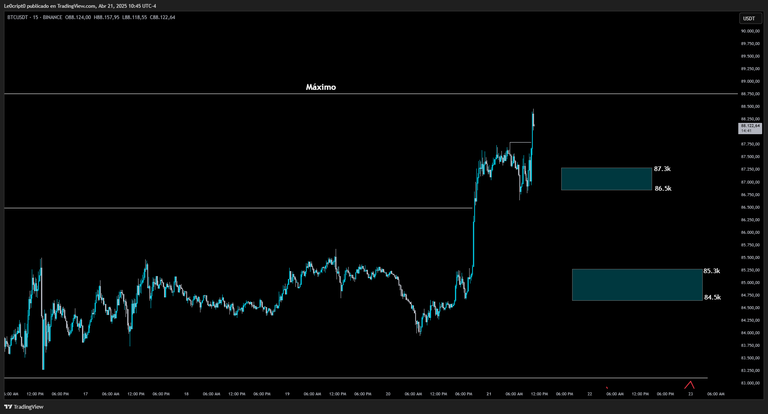
En gráfico de 15 minutos la fuerza alcista es bastante clara con el precio haciendo máximos y mínimos cada vez mayores. En el gráfico tengo 2 zonas marcadas en azul que pueden ser puntos de posible retroceso e idóneos para intentar sumarnos a la tendencia alcista
Esta temporalidad es para buscar operaciones a corto plazo, por tanto las zonas marcadas tienen validez solo para las próximas horas o días como máximo si el precio no hace ningún movimiento relevante.
Reflexión Final
Gracias por llegar hasta aquí. Recuerda que este análisis es parte de mi propio proceso de aprendizaje y crecimiento como trader, y lo comparto contigo con la intención de aportar valor. Si algo de esto te sirve para mejorar tu perspectiva o tomar mejores decisiones, entonces ha valido la pena.
Nos vemos la próxima semana con otro análisis.
¡Mucho éxito y buen trading!
ENGLISH
In this weekly post, I share my interpretation of the cryptocurrency market, mainly Bitcoin. You'll find a detailed analysis of my perspectives, planning, and ideas for potential trades.
- Technical analysis of the charts DAILY, 4-HOUR, 1-HOUR or 15-MINUTES
- Zones of interest.
- Potential tradeable movements.
- Ideas and reflections on what I expect for my trading throughout the week.
- My action plan.
IMPORTANT: This is not an attempt to predict or anticipate price movements, but an objective plan to react to the different possible scenarios that may occur during my trading week. I share it with you hoping it will be useful. Remember that trading is a risky activity where you can lose your money, so be very careful with the decisions you make.
DAILY CHART
In the DAILY CHART, little has changed since last week’s analysis. The main trend remains bullish and we are currently in a pullback within that trend.
The price has stayed at the upper part of the range, and with the markets opening yesterday (Sunday), it has shown bullish strength with a +5% rise between yesterday and today. This could indicate the start of a bullish week that may take us back to 90k.
4-HOUR CHART
On the H4, price action is a bit more complicated to interpret since it remained in a tight range throughout the weekend, which was broken to the upside on Sunday during the Asian market open.
Even so, the current zone remains ideal for looking for shorts if the price starts to show weakness. It's important to always have your Stop Loss well placed in this key zone.
1-HOUR/15-MINUTE CHART
In the 15-minute chart, the bullish strength is quite clear with the price making higher highs and higher lows. On the chart, I have two zones marked in blue that may be potential retracement points and ideal to try to join the bullish trend.
This timeframe is for short-term trades, so the marked zones are only valid for the next few hours or days at most, if the price doesn't make any major moves.
Final Reflection
Thank you for making it this far. Remember this analysis is part of my own learning and growth process as a trader, and I share it with you with the intention of bringing value. If any of this helps you improve your perspective or make better decisions, then it has been worth it.
See you next week with another analysis.
Wishing you success and great trading!
Nota: Este post fue escrito originalmente en español y traducido al inglés con la ayuda de ChatGPT.
Todas las imágenes utilizadas fueron creadas en Canva y son capturas de pantalla tomadas desde TradingView.
Note: This post was originally written in Spanish and translated into English using ChatGPT.
All images used were created in Canva and are screenshots taken from TradingView.
Posted Using INLEO