ANALYSIS USING SUPPORT AND RESISTANCE STRATEGY
My analysis of the cryptomarket often begins from the higher timeframe to the lower timeframe, but I prefer beginning mine from the monthly timeframe.
The monthly timeframe helps me a lot in filtering out noise from the market, and alongside that, it also plays a huge role in the identification of market trends.

Begining with the monthly timeframe of the pair solusdt, we can see that there are bullish and bearish candles present in the market.
And we can also see that there are lesser candles on this timeframe, and this is because each candle is formed within the space of 1month.
Also on this timeframe, it is easier for the overall market trend to be detected, and we can see that the market is being bullish on its most recent legs.

I then continued my analysis by moving to the weekly timeframe, and on this timeframe I could see the market more clearly, I could see the formation of several candles as each candle is being formed within the trading period of 7days.
And looking carefully, I was able to identify a key level and this level is functioning as a support level to the price chart, and the market is expected to be rejected whenever it trades towards this level.
And from the above screenshot, we can see that this level is a valid level, as the market made noticeable reactions as it trades towards this level.
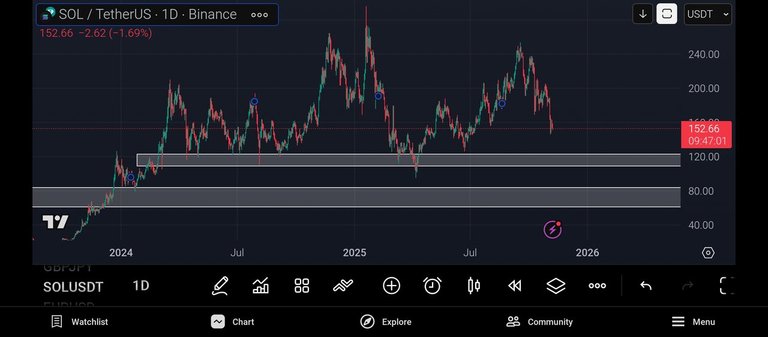
I then continued my analysis by moving to the daily timeframe, and on this timeframe I could see the market more clearly.
I could see the formation of several bullish and bearish candles which indicates the presence of the buyers and sellers in the market.
And looking carefully, I was able to identify another key level, and this level formerly functioned as a support level until it was broken and is now acting as a resistance level to the price chart.
From the above screenshot, we can see that the market broke below this level and we can also see that the market has traded towards the next support level, and as such, we can expect to find bullish rejection.

I then continued my analysis to the 4hr timeframe, and in this timeframe, I could see lots of noise in the market as the buyers and sellers struggle to drive the market to their preferred direction.
And looking carefully, I could see that the sellers have proven stronger in the market, as it kept forming lower highs and lower lows in the market.
Then I noticed a weakness in the selling pressure as the buyers have began creating new highs in the market.
With my bullish bias of the market, I then moved to the 2hr timeframe in search of an entry into the market.
And from the above screenshot, I noticed that the market has traded towards its support level and have been rejected, and it is time for me to place my buy entry on the market
And before then, I decided to search for confluence using the relative strength index indicator.
Congratulations @vivoni! You have completed the following achievement on the Hive blockchain And have been rewarded with New badge(s)
Your next target is to reach 50 upvotes.
You can view your badges on your board and compare yourself to others in the Ranking
If you no longer want to receive notifications, reply to this comment with the word
STOPCheck out our last posts: