There's a great deal of changes to the chart since last I posted.
Some of the biggest changes have been refactoring large chunks of the chart so that chart panes are treated generically which finally lead to making possible changing the stacking order of the panes. You'd like the RSI pane above the candles, yes, that is now possible.
This then led to a proper implementation of adding and removing chart panes on the fly.
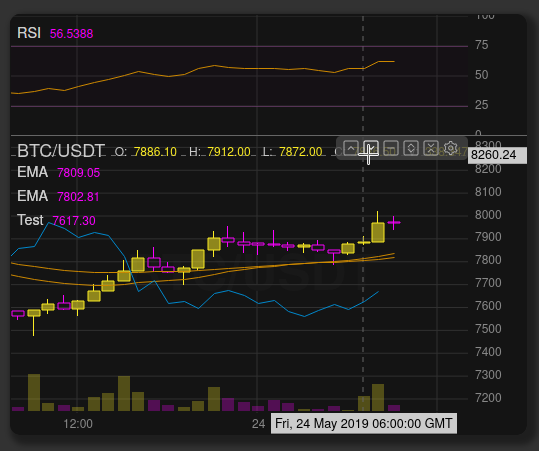
And then that led to GUI changes that display a set of control icons (see the image at the top) at the end of a pane or indicator legend. So you can now simply re-order the chart with a few mouse clicks.
The Utils bar is still an incomplete feature, but can be enabled via the config. If enabled, the Add Indicator menu now works, as the name implies, allowing the user to manually add indicators to the chart.
However, there is a great deal of work ahead of me to implement more indicators.
You can see how one change can lead to a cascade of progress in other features.
Then it was time to focus attention to the data state management. For a long time now, you could only start the chart with a block of back history or add a live price stream. Now it is possible merge more back history into the chart if the user scrolls left into the past.
As previously mentioned, one thing leads to another. Data merging then brought about being able to wholesale swap the entire chart contents for a new asset price history.
These aforementioned changes have now brought the chart more up to standard with essential features found in other trade charts.
There's a whole host of minor feature additions, changes and bug fixes also.
The chart is available via NPM
npm install tradex-chart
and GitHub