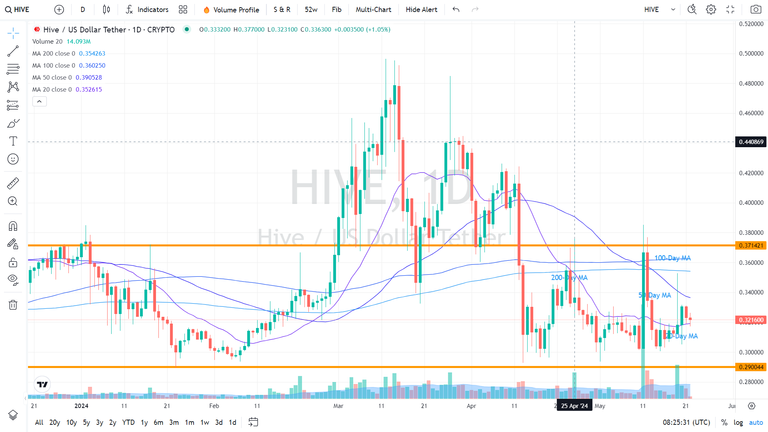
Observing the current chart of $HIVE, I notice a few interesting technical indicators.
One, the current price of HIVE is above 20 days MA and below the three MAs: 50, 100, and 200. The current chart is better compared to that of 21 days ago where the price of $HIVE was below the four moving averages.
At least, this time we see the short-term trend showing a direction change. It is good that the price has been climbing slowly for seven days now after making that base at 0.30 USD.
Another noteworthy observation is the decrease in volume. After the attempt to rally up to 0.35 USD failed on 19 May, we see that the volume started to decrease. If such an indicator appears in an uptrend, that will be interpreted as Volatility Contraction Pattern (VCP), a bullish indicator. It is not new that $HIVE moves in a way that nobody expects.
The last observation has something to do with the four moving averages. The long-term MAs show that the long-term trend is still intact for the 100 days MA is still above the 200 days MA.
As for short-term MAs, the 20 days are showing strength and are about to cross the 50 days. If this takes place, I read this as an indication that the short-term trend of $HIVE is about to change from bearish to bullish.
Ideally, what I anticipate is that the price will stay above 0.36 USD and it is better if that 0.37 USD resistance is broken in the coming days.