Like I said in my previous post, a Japanese candlestick is like a normal candle. it has two parts the body and the wick(shadow). The body represents the distance between the opening price and the closing price while the wick represents the extremes of the price for the particular trading session. So if the closing price is higher than the opening price then it means the price went up. This is usually denoted by a green candle. when the closing price is lower than the opening price, the candle becomes red meaning price went down. When a candle stick has wick at both ends, it means that price got to those levels but finally closed at the closing price. when a candle stick has a small body with a long upper shadow and a short lower shadow, it means that during that particular trading session buyers tried to push the price up, however the sellers were able to push it down to the closing price. it is vice versa for the candle stick with a longer lower wick. the colour of the body shows the market participants who dominated.
When the colour of the body is green or white, it means buyers dominated. when red or black it means sellers dominated.
Types of Candlesticks
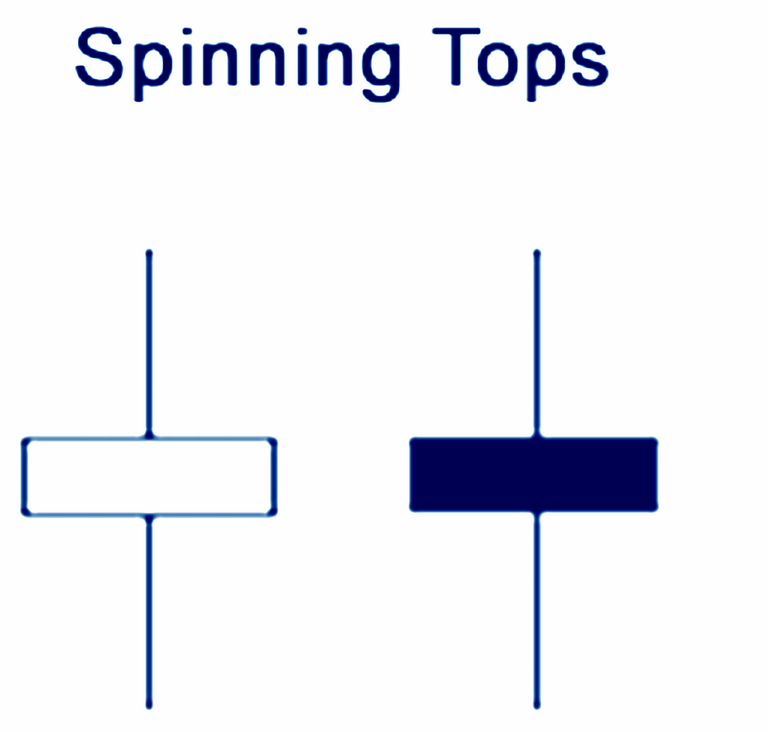
1. Spinnning tops
Babypips
These are candlesticks that have long wicks at both ends(almost equal wicks) and a small body with respect to the length of the wick. They usually mean indecision from the market participant. It is more like almost equal number of buyers and sellers in the market at that particular time period.
In this type of candle stick formmation, the colour is usually not so important. In situations like this, i advice beginners to sit and watch the market decide and then follow the decisoin of the market.
What does it mean when a spinning top appears on a chart?
like i earlier said it means indecision. however when you see it in an uptrend, it means there are not enough buyers to push the price up or the buyers are getting out powered by the sellers. Hence, the possibility of a reversal.
When a spinning top appears in a downtrend, it means sellers are loosing their selling power to keep pushing the price low. Hence, the possibility of a reversal.
if you are in such a trade and you are gaining, you should consider moving your stop loss in a way that if there is a reversal, you will be stopped out with a profit.
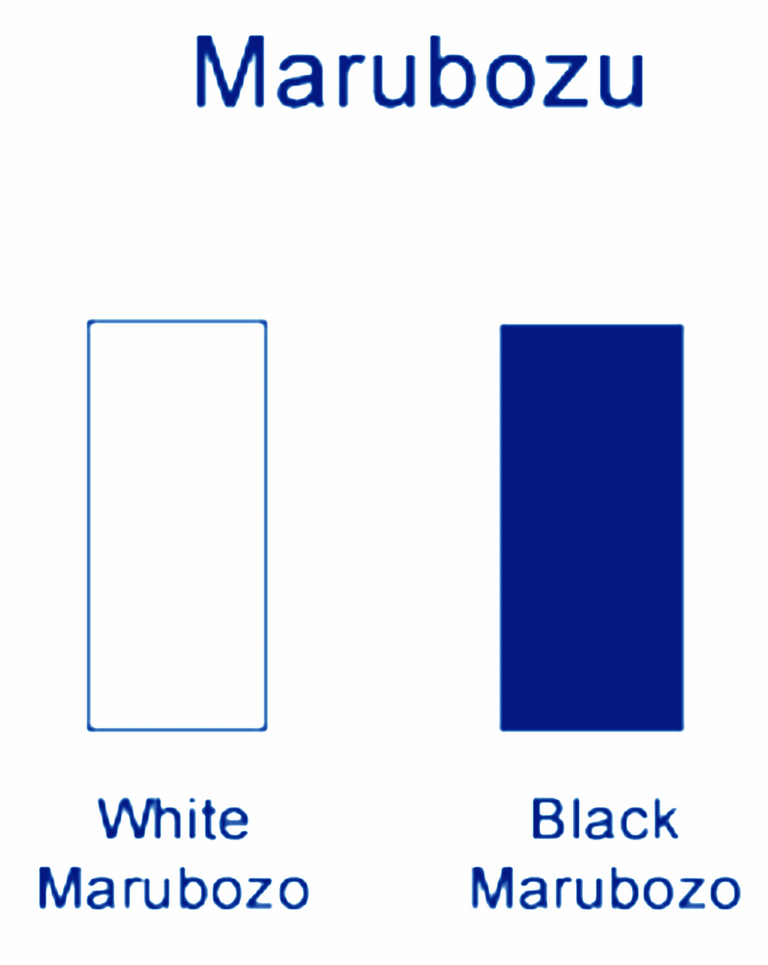
2.Marubozu
Babypips
Wikipedia defines a marubozu as a name of a Japanese candlesticks formation used in technical analysis to indicate a currency pair has traded strongly in one direction throughout the session and closed at its high or low price of the day.
In the most correct of terms, the opening price is equal to the low and the closing price is equal to the high for a bullish candle and the reverse is for the bearish candle .
When you spot a marubozu on a chart it just means the the market is one sided for that particular time period. if green then the buyers dominated and if red the sellers dominaed for that time period. It most times indicates continuity in either an uptrend or a downtrend.
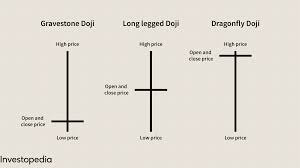
3. Doji
Investopedia
Dojis are simiiar to spinning tops just that they have no bodies or very little bodies.
Investopedia defines a Doji as a candlestick pattern in which the candlestick for a currency pair has an open and close that are virtually equal and are often components in patterns.
I personally feel that a
Doji shows more of a reversal than a spinning top, although they both mean indecision by the market participants. There are four types of Doji candlesticks according to babypips.
- long-legged Doji
- dragonfly Doji
- gravestone Doji
- four price Doji
These three types of candlesticks form the basis for the different types of candle stick patterns in the market. I will be talking about the different types of candle sticks pattern in my next post.
I'm impressed at the quality of this writing and the great information therein. Thanks for sharing.
I am learning forex because my experience is with coins and although candles are used the same are not the same, because in the forex market you win or lose when you close the deal while with coins is a change in value ie the $ go from one currency to another. that of the candles the pip and lots help understand the market.
If you are using margin it becomes the same.. the candle stick interpretation however are the same when it comes to direction of price.
Thank you for stopping by