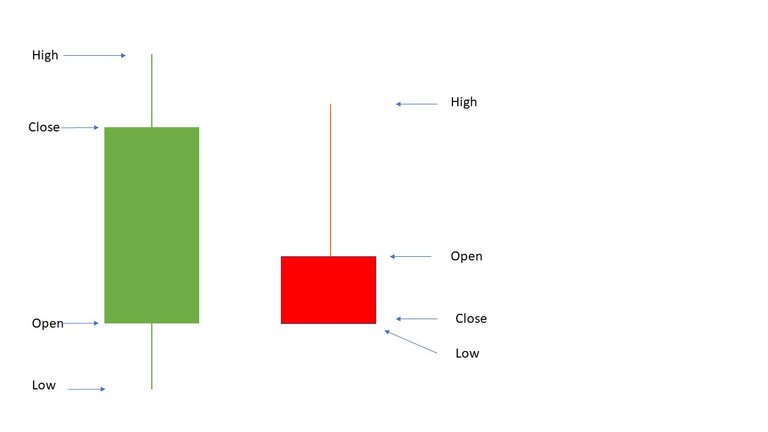
Picture 1. Candlesticks
Color of bar
A candlestick is formed by high, low, close and open price. These four defines the strength of the bull and bear, and how the price action looks like when it comes to the market. When open > close, the bar appears to be a bull green bar to indicate bull side has overcome the bear side on the selected timeframe. When open < close, the bar appears to be a bear red bar to indicate bull side has been defected by the bear side on the selected timeframe.
Wick and tail of the bar
Wick (on the top) and tail(down to the bottom) indicate the price rejection on the trading timeframe. A long wick shows a strong selling which a long tail indicate a strong buying. Observation of the wick and tail can tell how the price is being rejected. By coming with the color of bar and wick play, we can know how the strength of buyer and seller are doing on the timeframe.
Closing ranges
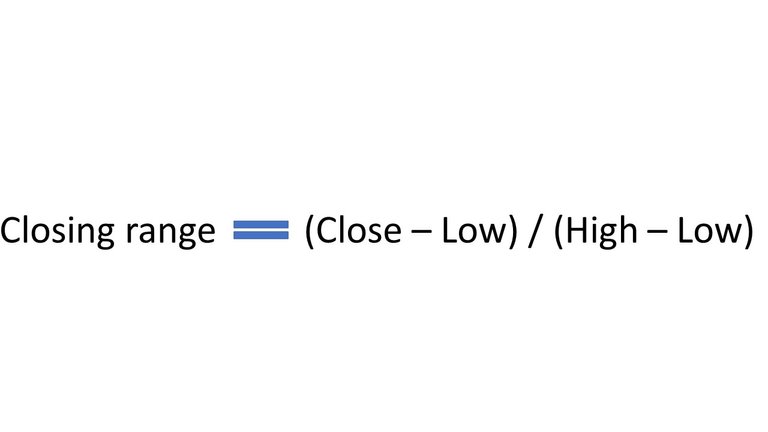
Picture 2. Calculation of trading range
Closing range is the body width of the candlestick and the calculation is as above. When the close is near the high, the bull is pretty strong. When the close is near the low, the bull is pretty weak. By observation of trading ranges, we can know how the bull looks like in the timeframe.
Generally speaking, a high closing range with more than 40% of the bar indicate the sign of strength of the bull. Observation of closing ranges shall be done only on higher timeframe for example daily or weekly charts as the price action is more important on those higher timeframe. When you observe the trading ranges for lower timeframe for trading plan, there are many whipsaw action and misleading price action to make you doing the bad trades.
Moreover, trading ranges shall be used together with volume characters in the context. For example, a good trading range with high volume usually indicate a strong bull action (you can think of a way that short sellers and sellers have found that the area is where they should take profits, it causes them to slow down the selling. Then, buyers step in as they found the area is where they should buy some shares. The overall impact causing a good trade range and volume, also the respective price action).
Trading ranges and volume character are extremely useful in observing the following:
- Natural reaction pullback
- Plan for trend retracement buying
- Sign of accumulation / distribution on the left and right side of chart before any breakout. If more good trading ranges with volume on the left side or along the pivot zone, it is a good sign institution is buying the shares.