Hello traders!
Today a setup for $IOST,
it recently had some major news announcement so I expect hthis one to progress upwards in price in the comming future.
To the chart straight away..
First the weekly chart ofr a better overview of the whole history
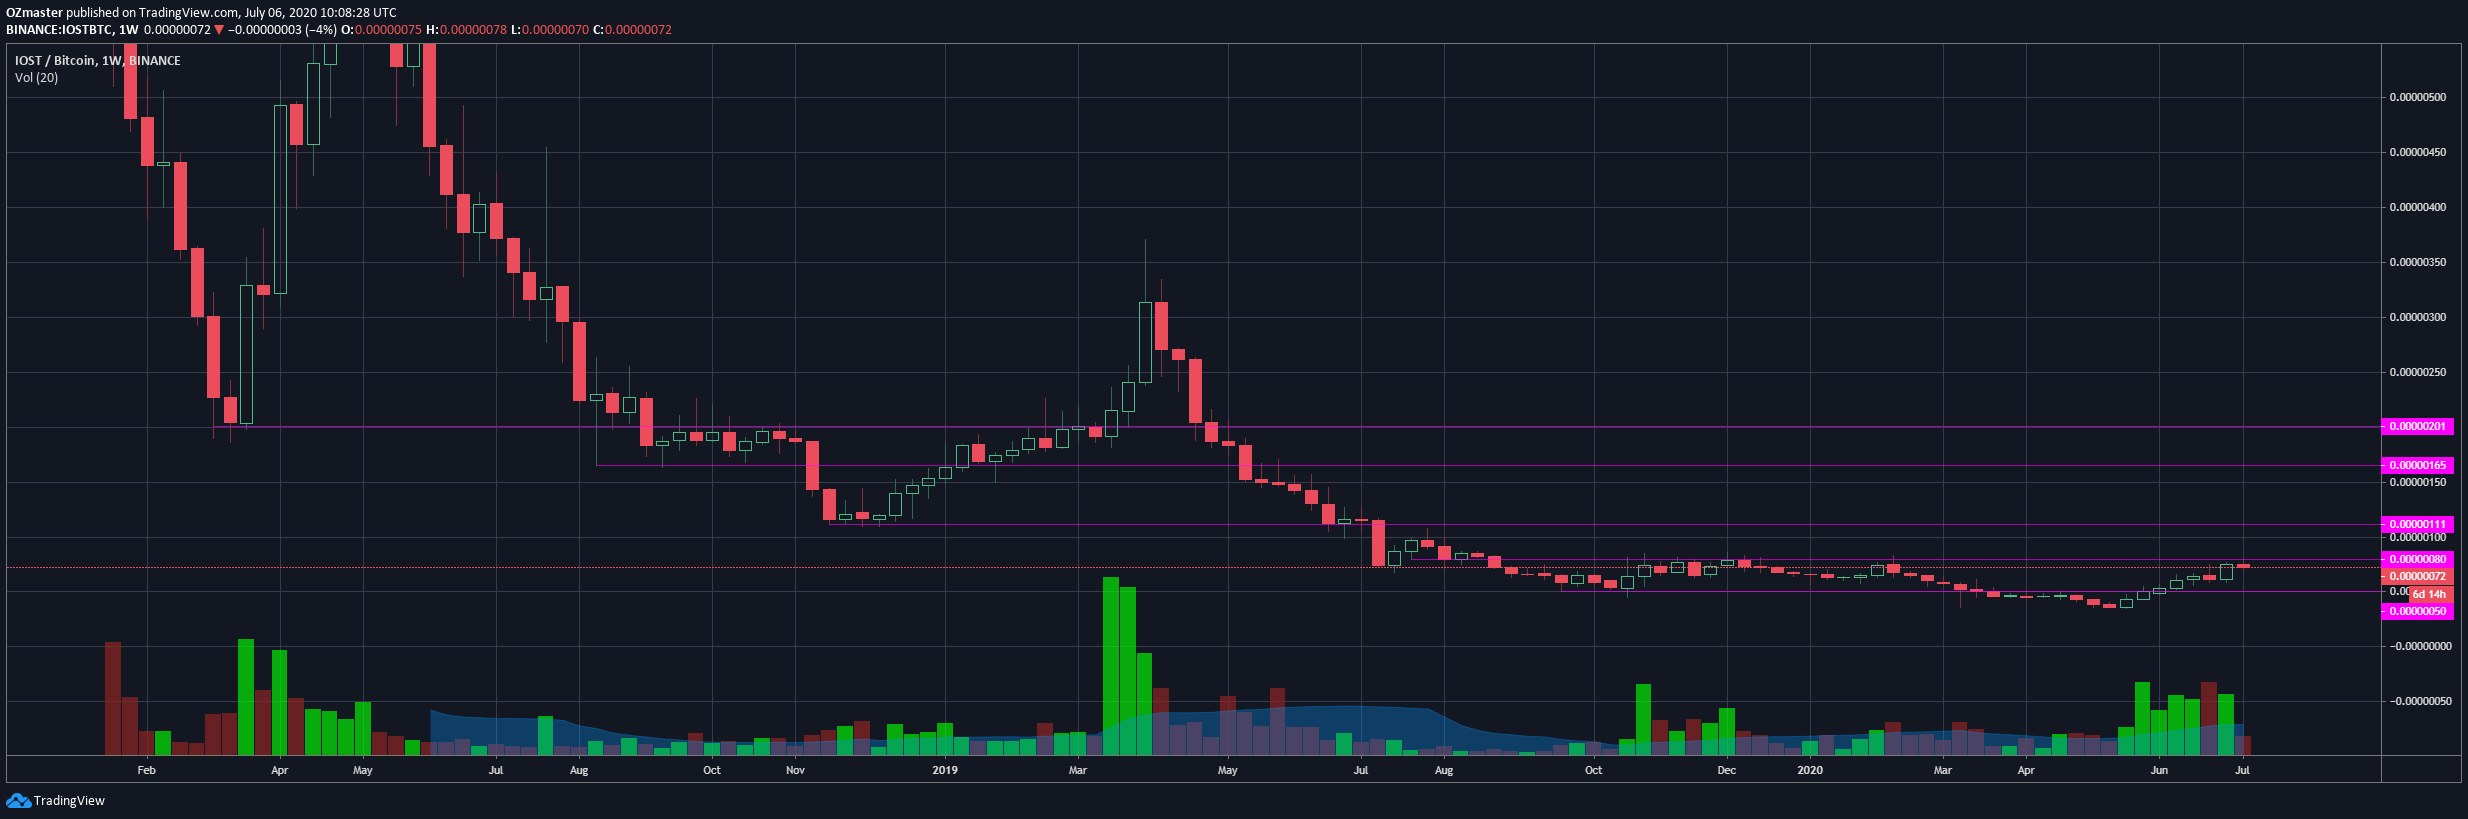
https://www.tradingview.com/x/cBYvTDOH/
Marked some support/resistance lines already with the purple lines on the weekly,
now zooming into the daily chart on the more recent timeframe.
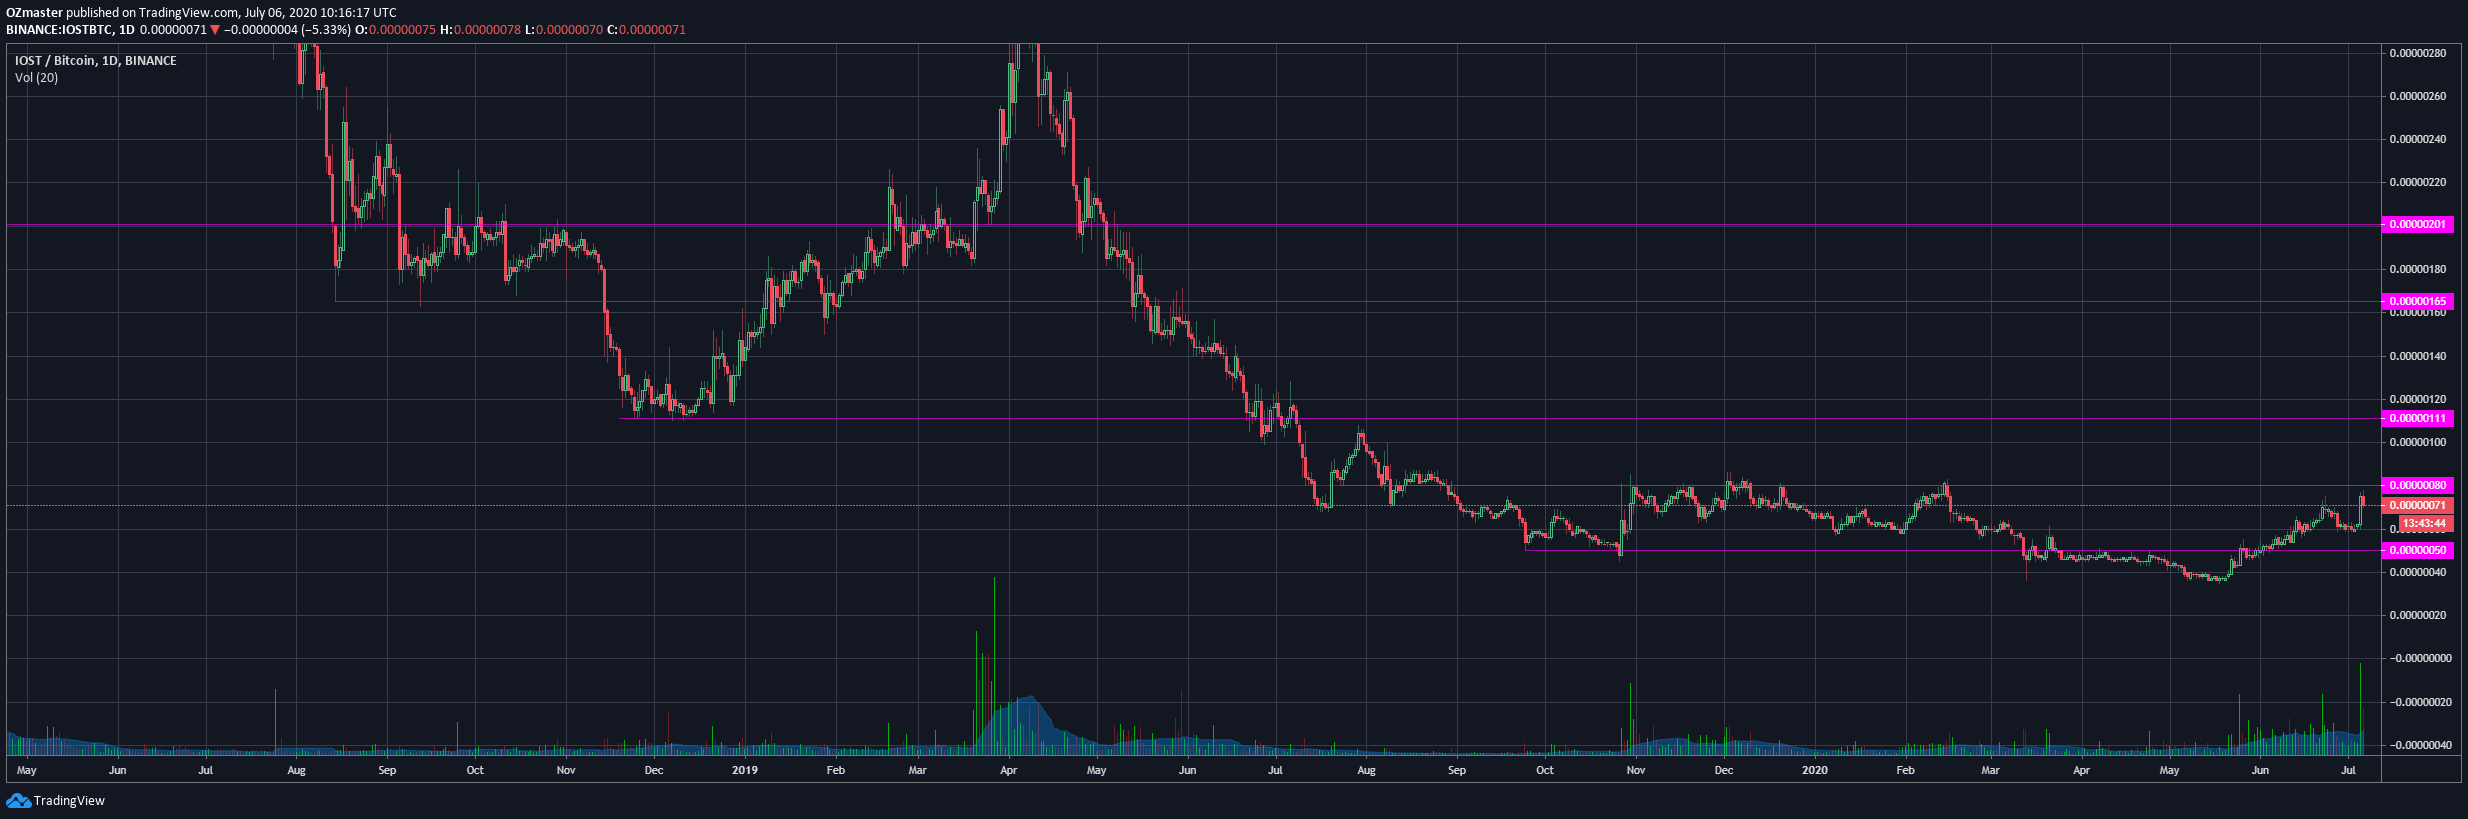
https://www.tradingview.com/x/0UXVcmjN/
Lets start from the bottom up,
First on the list the 50 satoshi line, played a role as a major support line in late 19' and early 20', thereafter, for a short while, it acted as a hard resistance level which the price used to make a new all time low, right after making it, it broke the 50 satoshi line on the upside, possibly marking the start of an longer term uptrend.
Next up, the 80 satoshi line, which we can see played a role as a very hard resistance level throughout the 2nd half of 2019 and we are seeing the price having trobules breaking above it even in recent few days.
Breaking this line to the upside would confirm a this trade setup for me.
The ~111 satoshi line we can see played a role as a major support (and at that time even an all time low) in late 2018/ early 2019, from which the price made a massive bounce resulting in gains above 200% over the course of few weeks.
Given the historical impact I would see this line as my first target and look for a shorter term retrace.
Next on the list, the 165 satoshi line, once again if you look to the left you can see the level around the line playing a crucial role in the price's history(look back at the weekly for refrence), acting first as support level and later turning into a heavy resistance, which, after breaking, the price never revisited.
Making this line my first exit point in this setup.
Finally we have the 200 satoshi line, which we can see played a major role in the past,
first time the price has visited these levels was in March 2018 when it became an all time low and a turning point from IOST made it's biggest runnup, to 800 satoshi,.
Lateron in September of the same year it broke to the downside and became a hard resistance line for the rest of 2018 and early 2019.
And at the end a fib line for some further confirmation
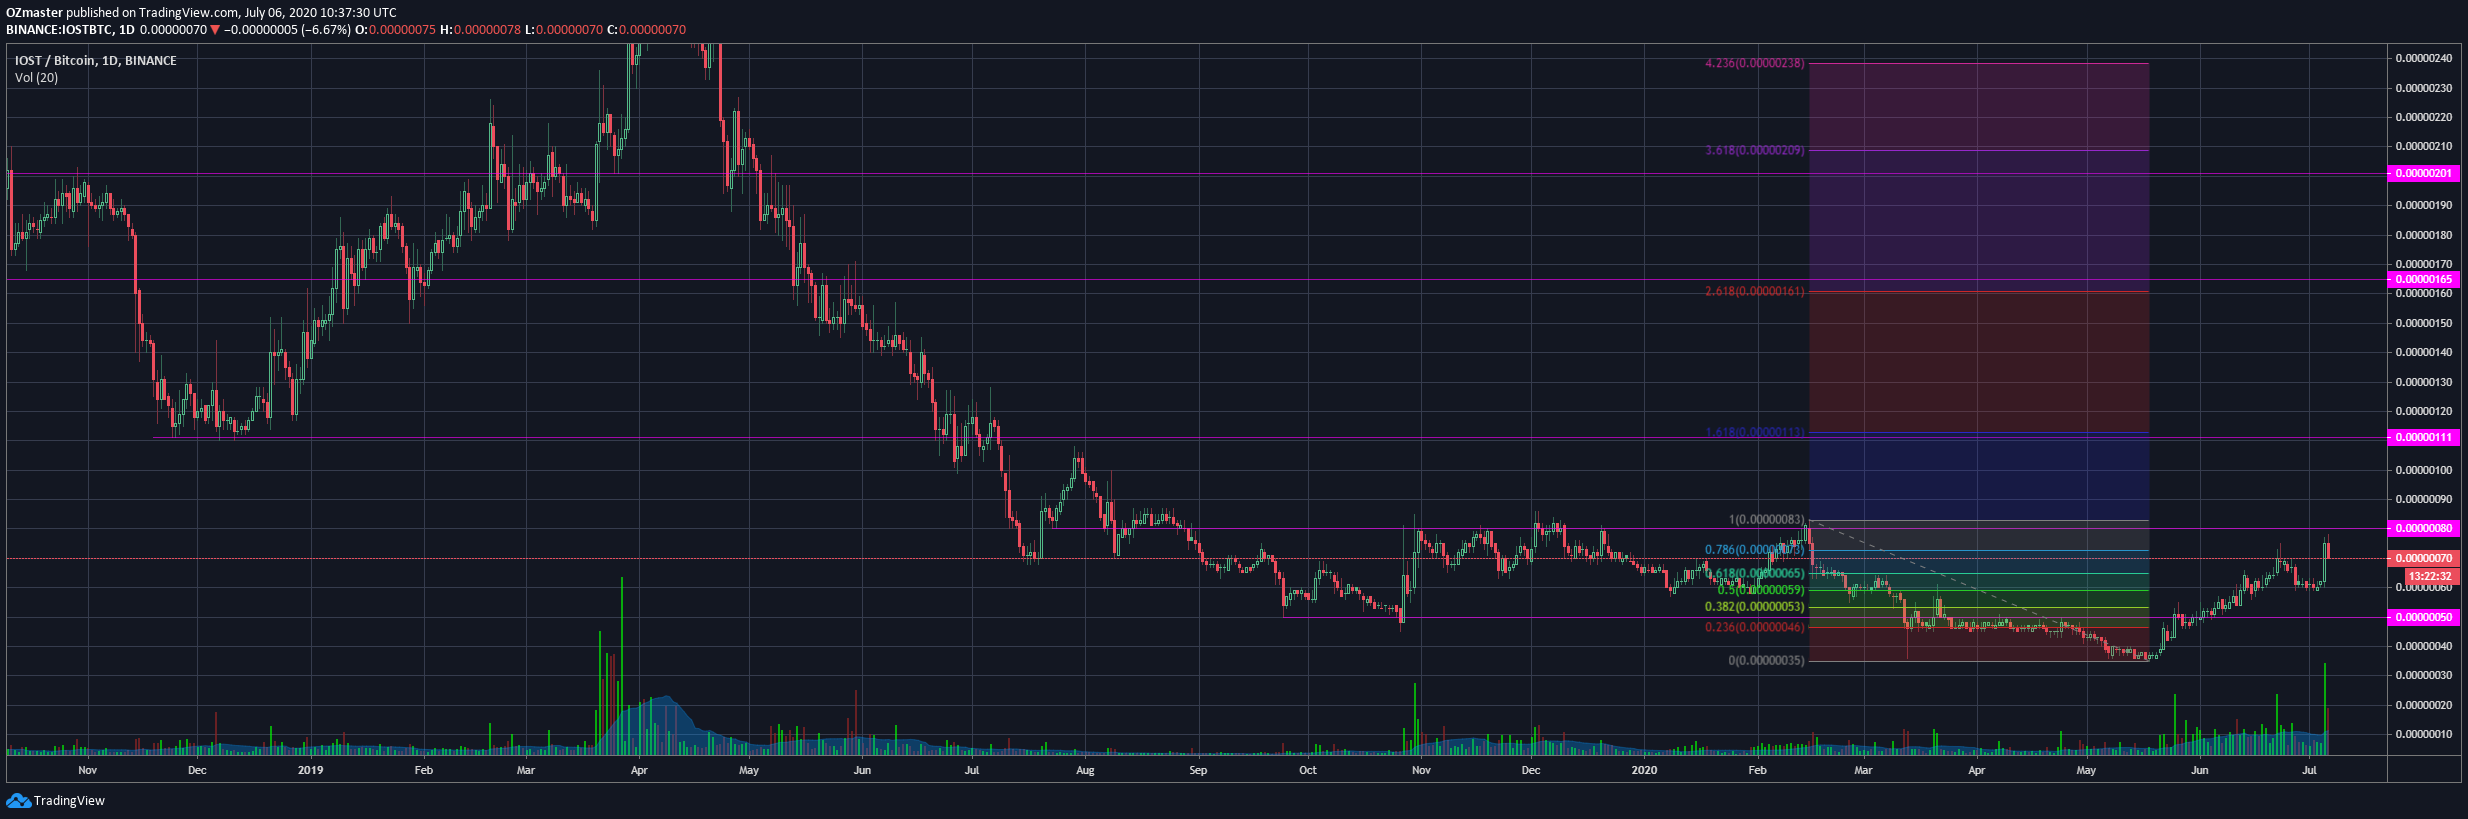
https://www.tradingview.com/x/2StnZZPF/
As seen on the chart the 1.618 almost perfectly corelates with the 111 satoshi line,
The 165 satoshi line is a bit less corelated with a fib line, but the 2.618 sitting at 161 is corelation enough for me.
And for the end we have the 200 satoshi line, the closest fib to it is the 3.618 at 209 satoshi, again close enough for me (i give it a 10%+- always).
Looking at the chart with both the lines and fibs on makes me do one more comment,
the area the 165 and 200 saothi lines seems to be a channel in which the price tended to trade up and down, so I would look into getting a few trade in while it's in the range.
Have fun charting and trading, and remember, always have a plan!
This post is NOT financial advice or any kind of recomandation, nor am I lisenced to give one!
It is my personal opinion and view on the chart!
I may or may not hold this particular asset.
Kind regards, OZ
Excelente información, muchas gracias, feliz día.