Hi traders!
Today I'm analyzing the DigitalNote ($XDN) chart on Bittrex.
$XDN is an old coin from 2014, with a marketcap of ~220~295 BTC with the price sitting between 3 and 4 satoshi at the moment.
I will be focusing on the short to mid term in this post and with it the lower price levels of the chart.
Lets start with the weekly chart to get a good overview of the bigger picture:
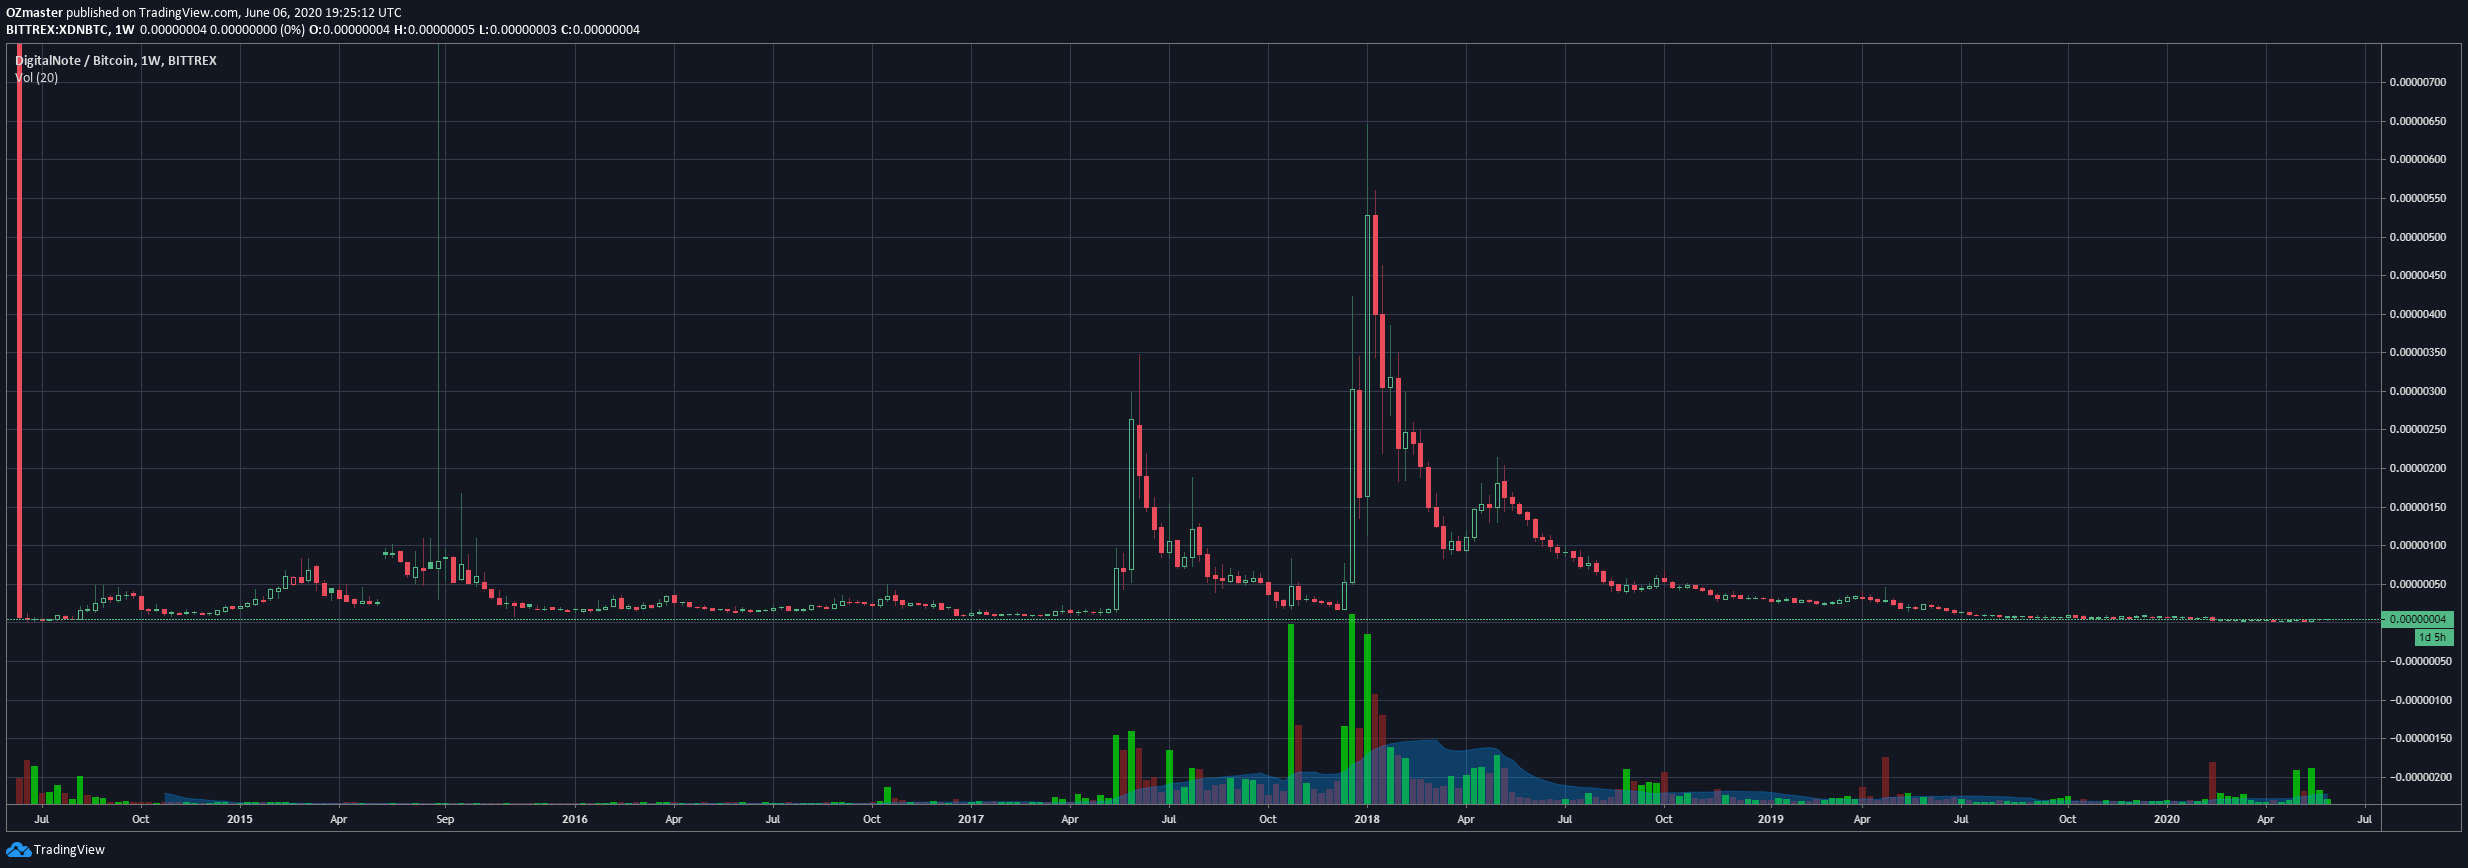
https://www.tradingview.com/x/IGYmHncF/
As you can see XDN had quite a history, from being at an all time low of 2 satoshi which it revisited just recently, to highs of 650 satoshi.
Like most coins out there, XDN has been in a downtrend since 2018 and is now trading at 3-4 satoshi, just a tick above the all time low level which was used as support.
To get a better view on what's goin on on the lower price levels I'm gonna switch to a daily chart and zoom in on those low levels, cos that's where I'll be focusing:
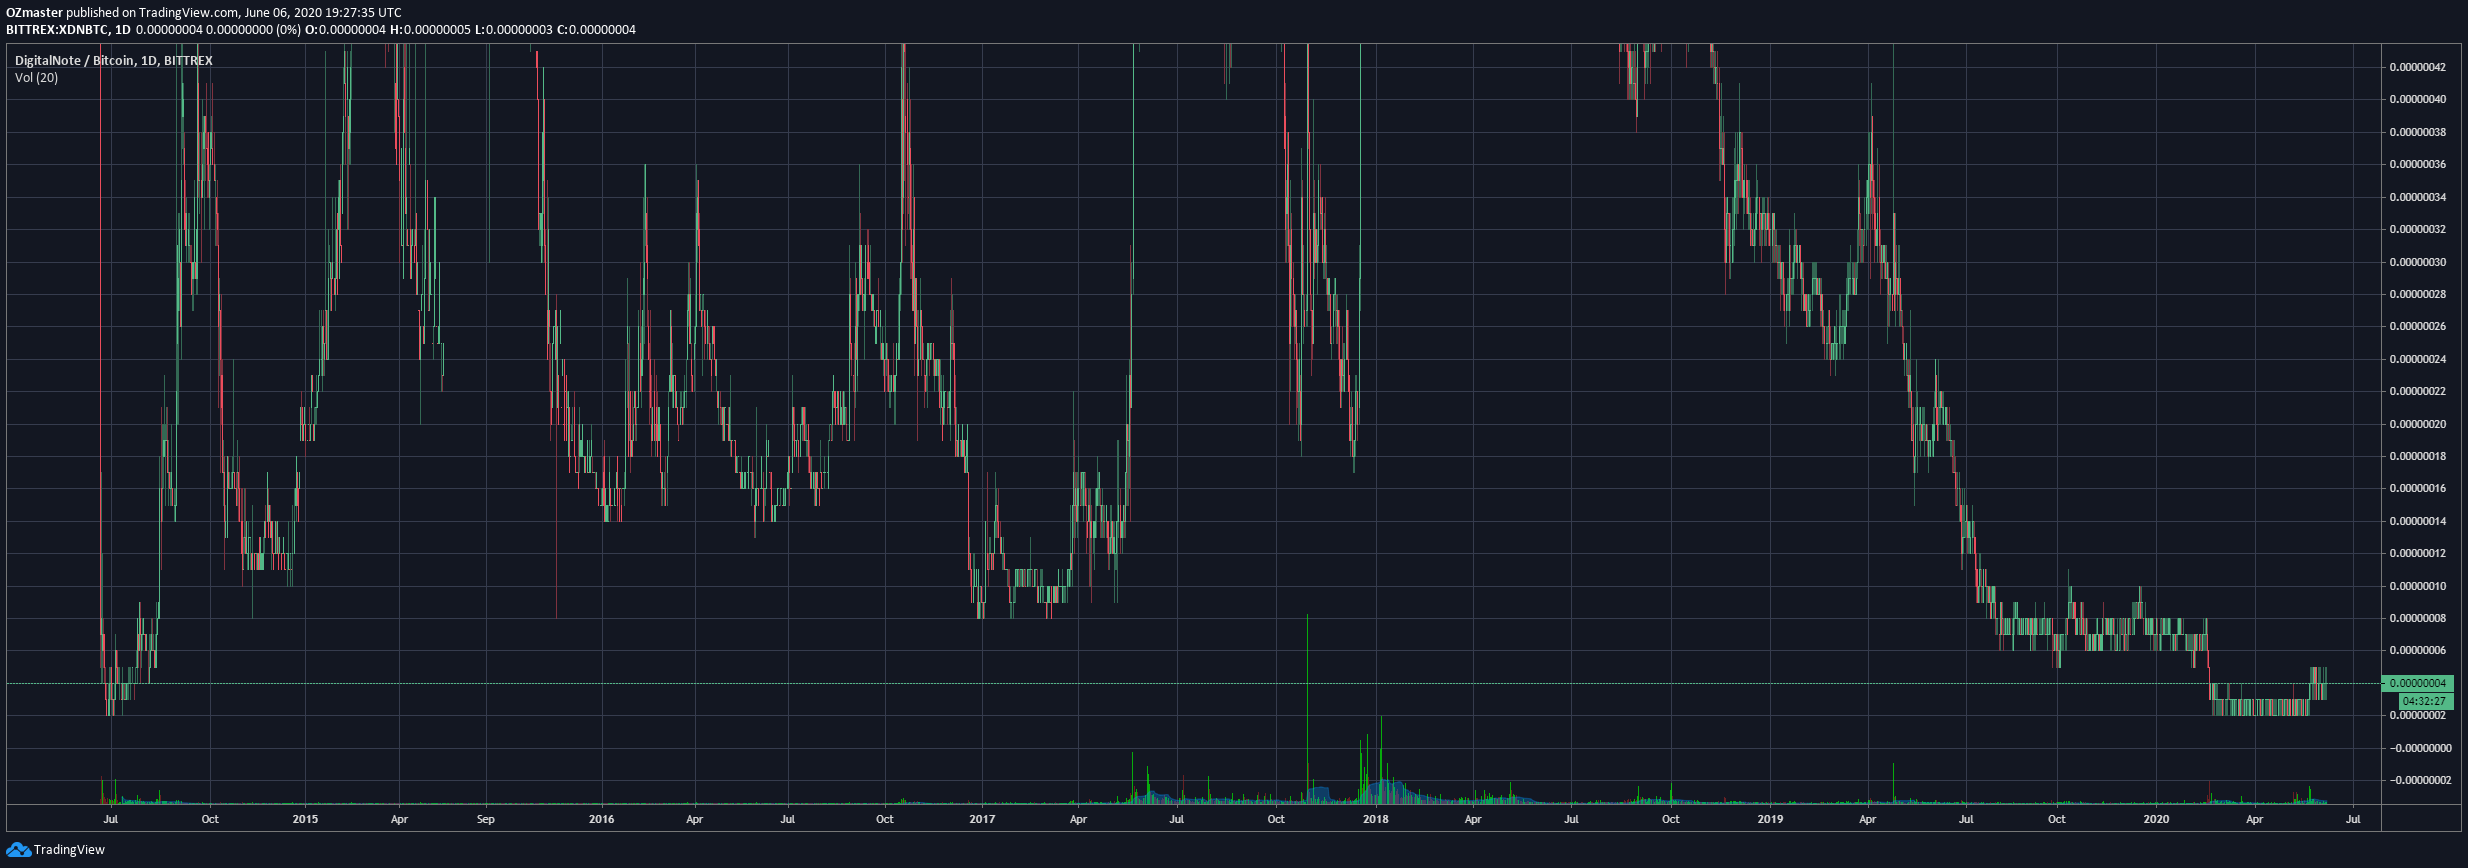
https://www.tradingview.com/x/yNBxznM3/
Now it's easier to indentify some important support resistance lines on this lower levels of the chart.
We can see how the all time low of 2 satoshi was used as the final support.
Now lets mark some of the resistance line's:
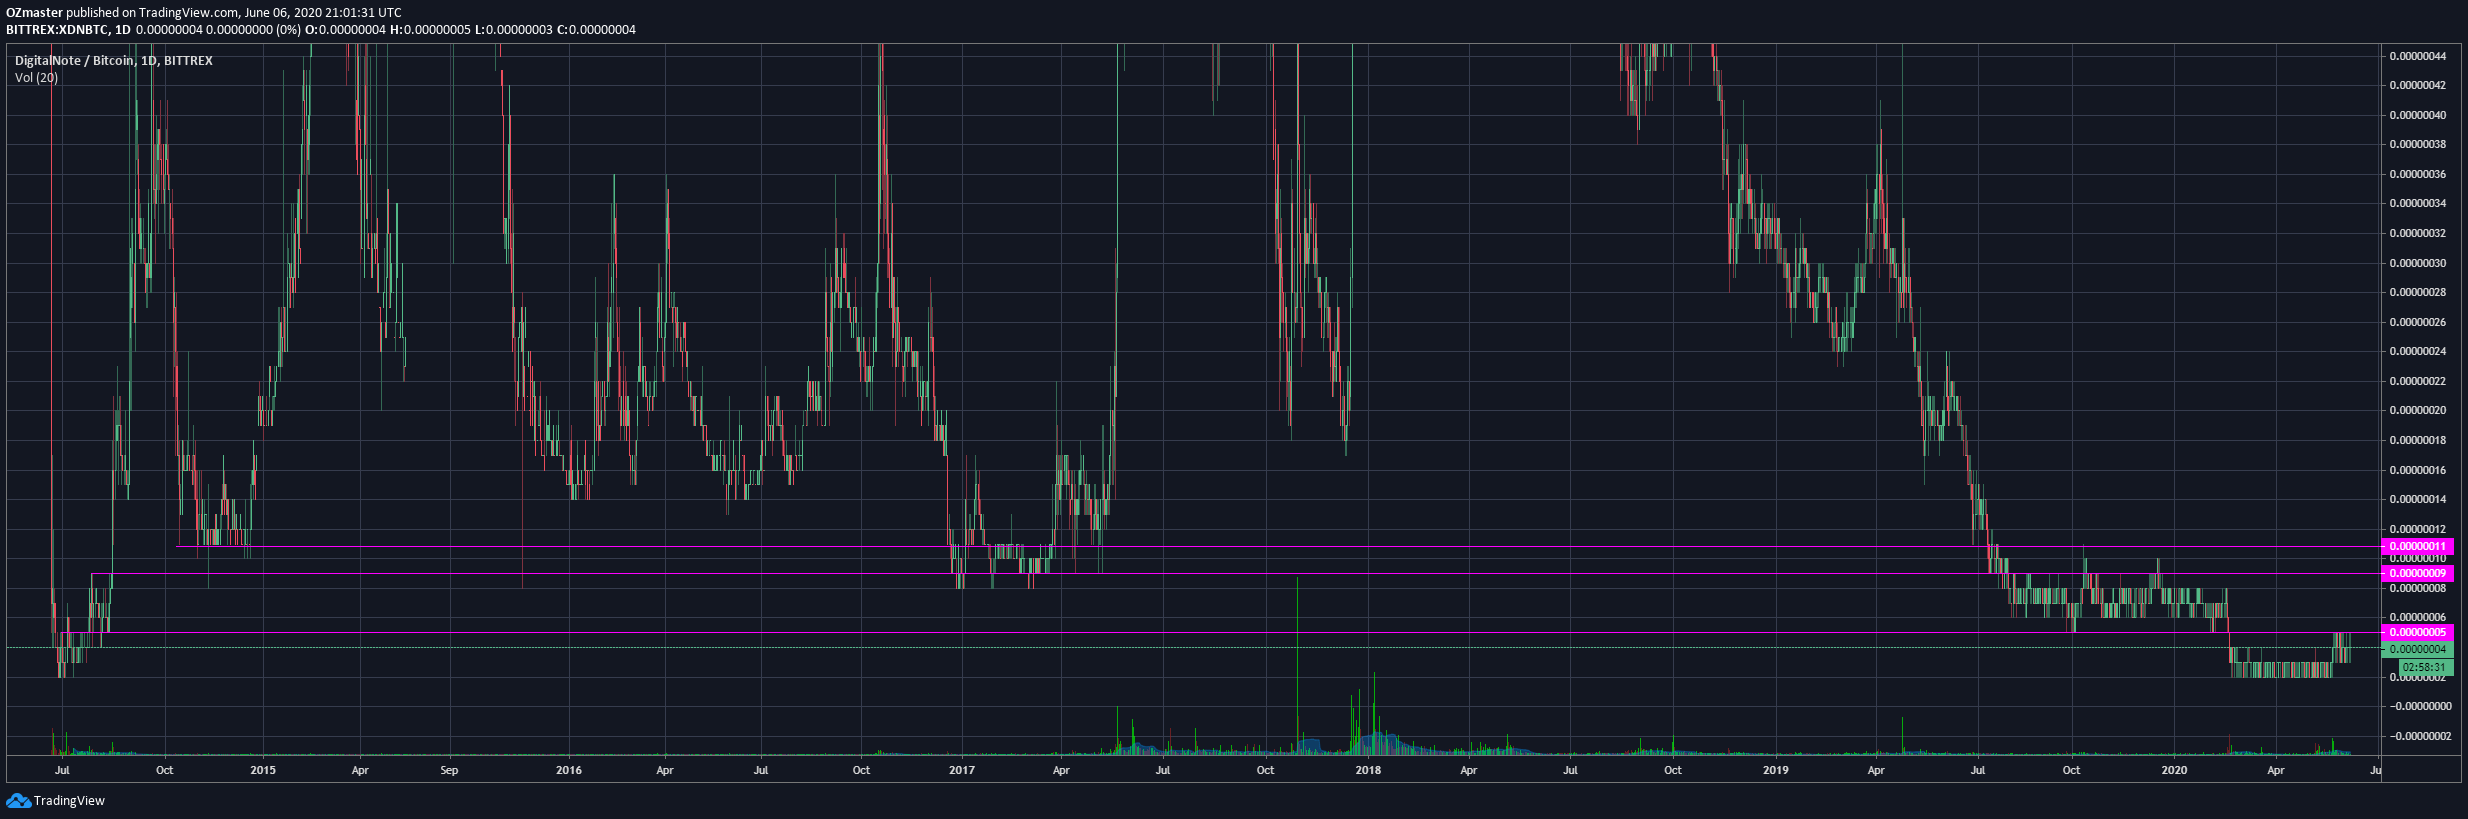
https://www.tradingview.com/x/4EPcSdeH/
First up we can notice the 5 satoshi resistance level.
As you can see, this is the first resistance level, one that kept the price bellow back in 14', the same is being reviseted these days as the price rose from it's support of the all time low on 2 satoshi.
Next up we have the 9 satoshi line, first marked also in 14', This one was used as a resistance in 2014, the price marked a local high at the 9 satoshi and then had a hard pullback down to the previously mentioned 5 satoshi resistance, which at that point became the new support.
Even now, a few years later, in 19' &20' we see the price comming down to the same 5 satoshi support and trading between it and the 9 satoshi resistance for a few months.
And the final line I wanna mentionhere is the 11 satoshi line, which was first marked as a support line back in Oct. 14'.
This one, together with the 9 satoshi line played a role of a strong support zone for XDN over the years with the price dropping to it multiple times, only to be pushed upwards after short periods of time.
In 19' the 9-11 satoshi zone became a hard resistance area pushing the price down to 5 satoshi and ultimately to it's low of 2 satoshi.
I expect this area to keep playing a role of hard resistance with the price taking more then just one try to break above it, hence I see it as a target in this setup.
As some of you who follow me might have noticed I like pulling up fibs, and althou arguably this is not worth as much on XDN for such low levels because the coin moves 1 satoshi at the time, I'm gonna still do it, just to have peace of mind.
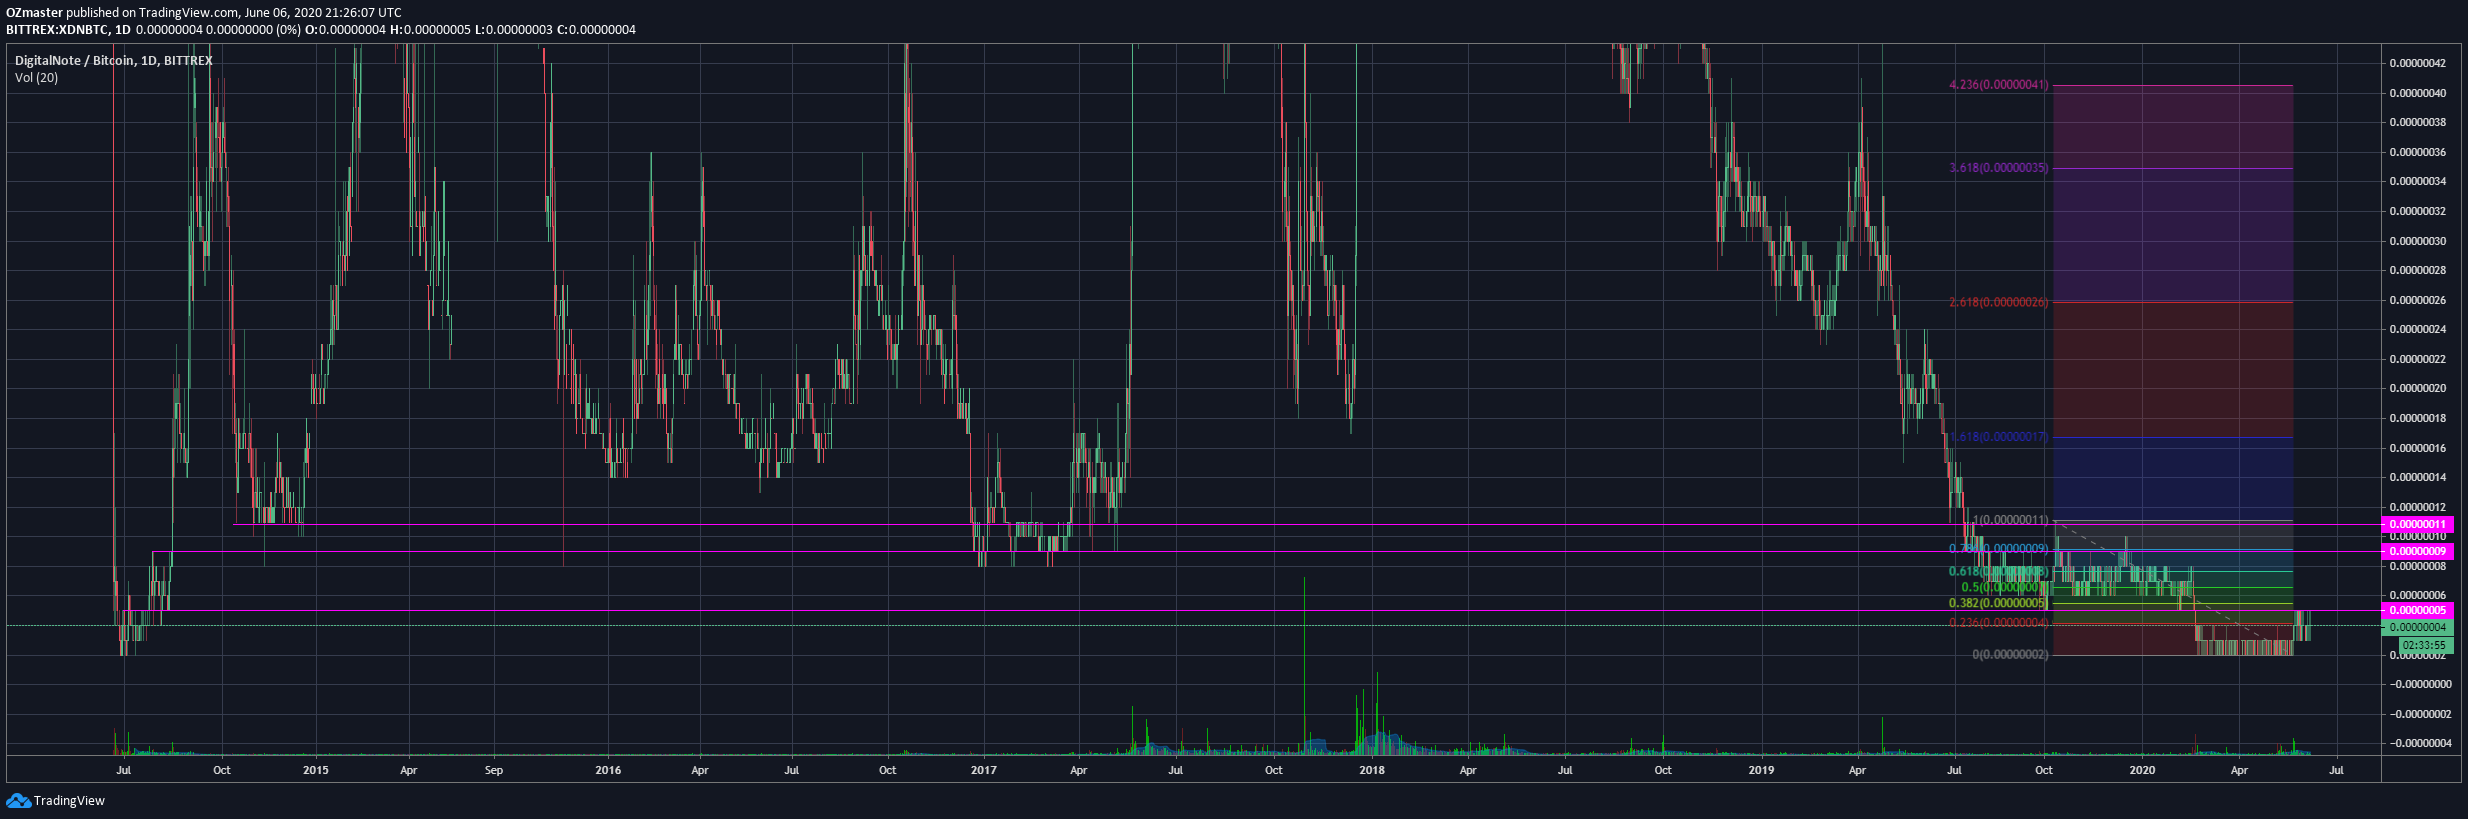
https://www.tradingview.com/x/EY0x6TFJ/
As you can see, all of the lines basicly corespond to the fib levels, the 0.382, 0.786 and 1 respectivly, no suprise there, but another one that drew my attention is the 1.618 (dark blue) fibline, if you look left, you can see this level was also used as a support resistance, last time in May 19', which would make it a target in case of FOMO (fear of missing out by retail).
If you wanna DYOR (Do Your Own Research) here are some usefull links for XDN:
Website- https://digitalnote.org/
BCT thread- https://bitcointalk.org/index.php?topic=4451957.msg39816386#msg39816386
Github- https://github.com/DigitalNoteXDN
Twitter- https://twitter.com/digitalnotexdn?lang=en
CMC- https://coinmarketcap.com/currencies/digitalnote/
Please keep in mind, this post is NOT financial advice or any kind of recomandation, nor am I lisenced to give one!
It is my personal opinion and view on the chart!
Keep the charts fresh!
Kind regards, OZ
This is an opportunity to get a double bang out. Will look more on it. Thanks for sharing.