Hello traders!
Today I was playing around with the $XZC chart on binance and noticed a nice setup for a trade.
https://www.tradingview.com/x/qTisxkvw/
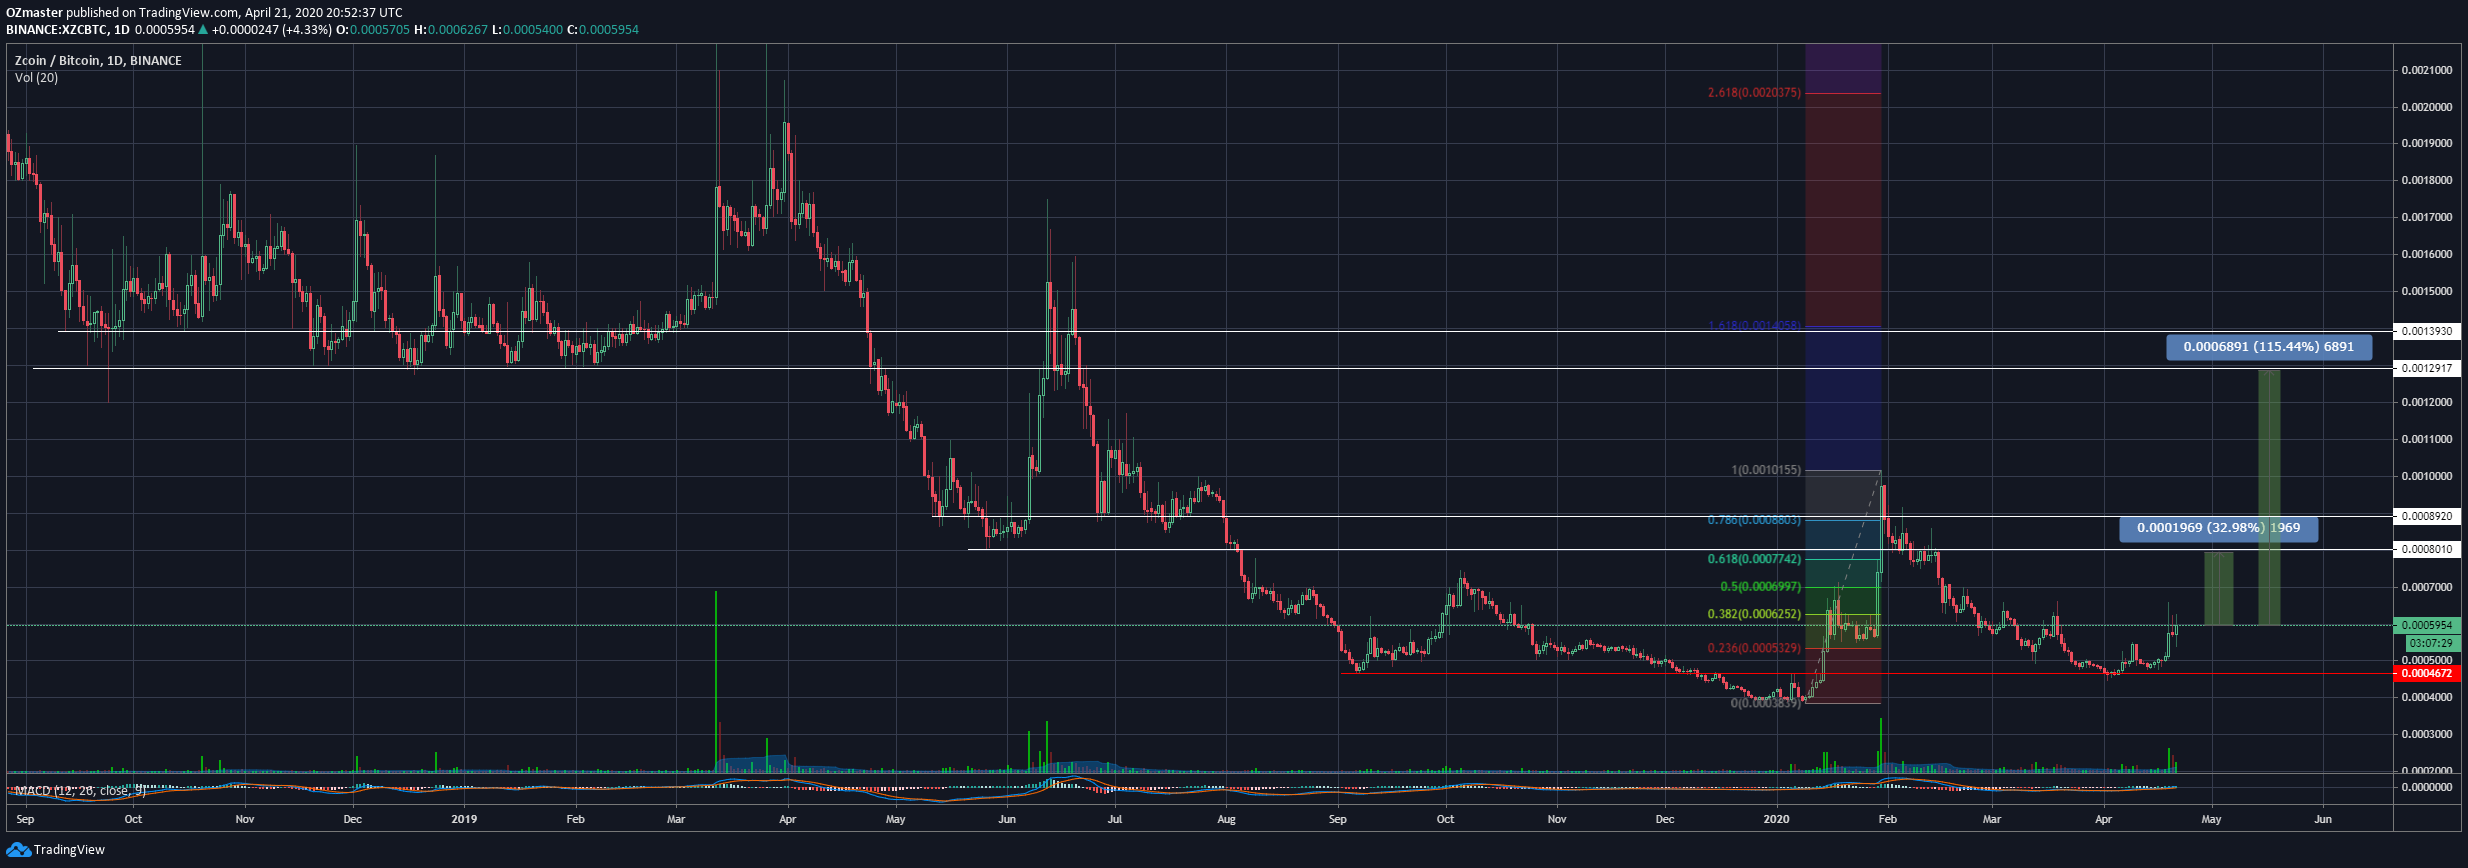
As you can see on the chart, XZC made a low at ~0.00038 BTC after which it ralied to 0.001.
After the hard runup came a retrace to ~0.00046 BTC marking a higeher low, which I marked with a red line. If you look left you can see how this level was used a support and resistance point in the not so distant history.
Closing a daily candle bellow it, would make me abandon this trade.
For this trade I have 2 target zones.
1st one being between 0.0008 and 0.0009 BTC, the zone closely corelates with the 0.618 and 0.786 fib lines on the upper and lower side and have been used as a support area last summer.
This would be a ~30% gain compared to where the price is now.
My 2nd target, in this case looking at a higher high compared to the last runup, would be the tone between 0.0013 and 0.0014 BTC.
By analyzing the chart you can see that the area was used as a strong support area in 2018.
After it broke in mid 2019, the price dropped to my 1st targer after which came a bounce where the 0.0013-0.0014 area was then used as strong resistance.
All of this lets me believe it's a zone which could act as a strong resistance in the comming future.
This post is NOT financial advice or any kind of recomandation, nor am I lisenced to give one!
It is my personal opinion and view on the chart!
Enjoy the day and good luck in the markets!
Kind regards, OZ