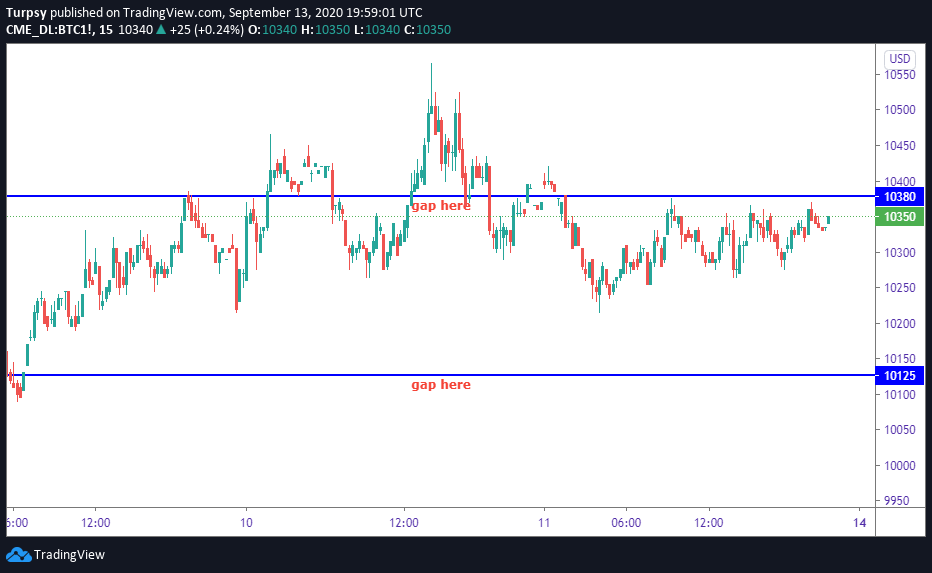
The gaps are also found on the CME chart and may be filled if the price moves in that direction. We have had a good rally and a new setup may be forming for the next price movement.
10380, -Not yet
10125- Not yet
9215 -Not yet
8840 USD. - Not yet
https://www.tradingview.com/x/3TZMj0xG/
This is my entry for the 100DAYSOFTA challenge, Sunday 13th September 2020.
__
I am joining a challenge by a group of traders. The challenge is #100DAYSOFTA. Some of the people in this group have posted on $Youtube, $Twitter but I will be posting mine on Hive.
The convener of this challenge is https://twitter.com/CryptoluXP*
However, the frequency might not be daily but it will be sequential.
Having said that, here is what I have:
__
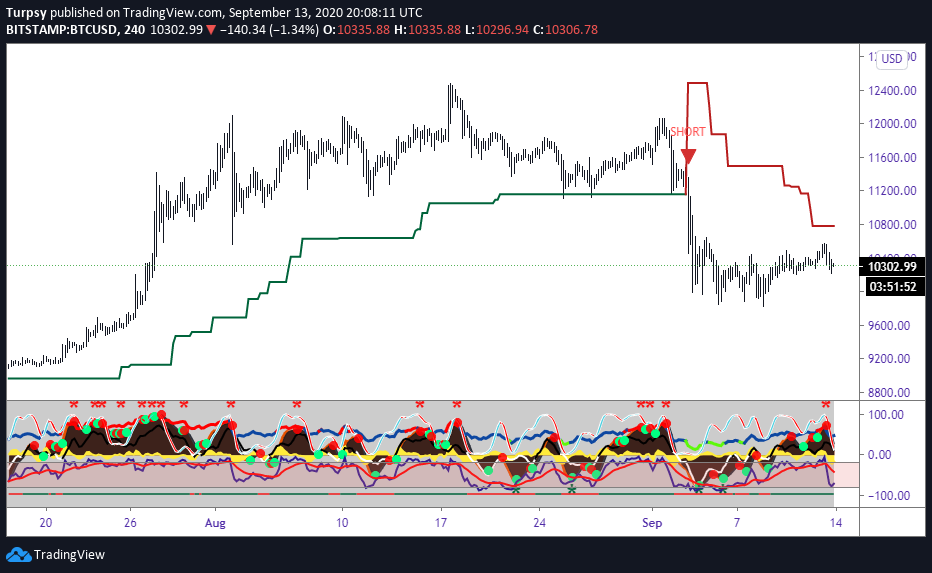
4 hr
The trend has been bearish, choppy and ranging for the past days especially after the dump. This shows that we have some price regauging at that level. The ST is still short and this has been making price to go downwards. Also, we have Willy going back to oversold region and will be resetting in the coming days. This shows that we may have some price action that will be confusing. Looking at the wavetrend also, we can see the red bearish dot already flashed.
https://www.tradingview.com/x/onzD79mz/
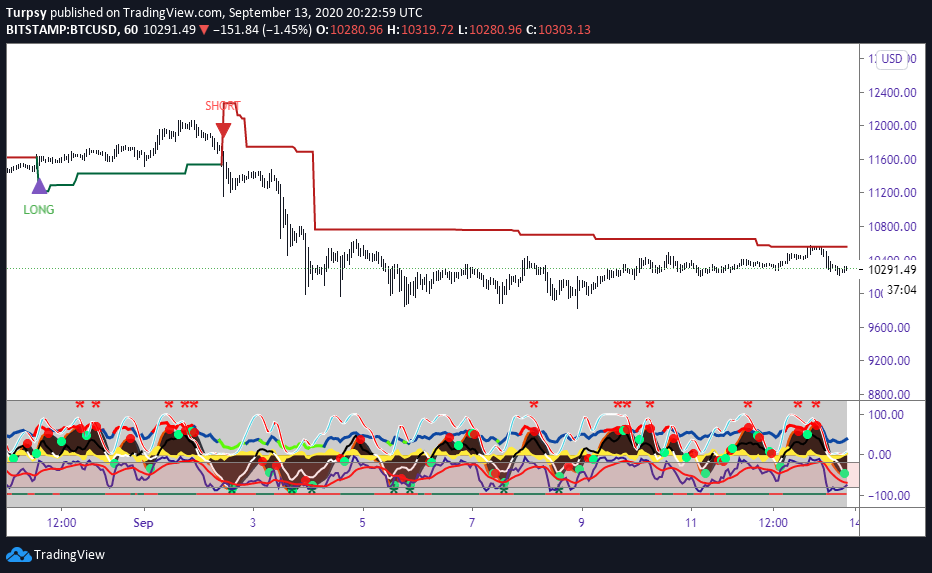
1h
The ST is active revisiting any price movement here. We can see that the price was rejected when it got to the resistance as shown by the ST at 10560 USD. The BTC price has since then retraced significantly. We can see that we have Willy forming a bullish cross over, with a green bullish dot showing up on the wave trend. This means we may have a second test of the reisitance on the ST.
https://www.tradingview.com/x/MzrxjpPR/
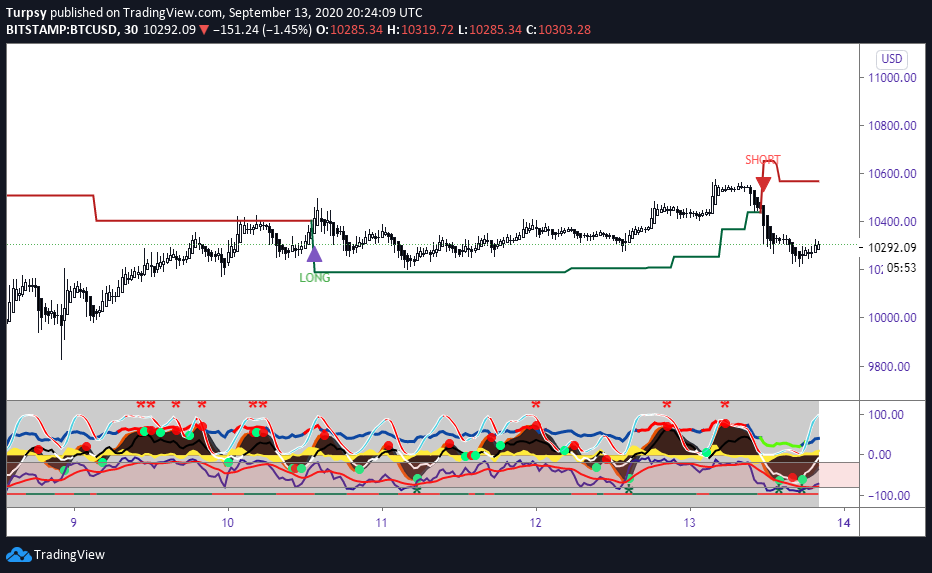
30 mins
The ST has flipped short on this TF, this shows that the reisitance now will be around 10560 USD. We already have some bearish price action and this is visible on the chart. Willy is shown to have a bullish cross over, which means we may have some pump in the price. Also, we have a bullish green dot shown as well. The current price action needs more patience.
https://www.tradingview.com/x/2DGHDL8x/
Extras
15mins and 5 mins charts respectively.
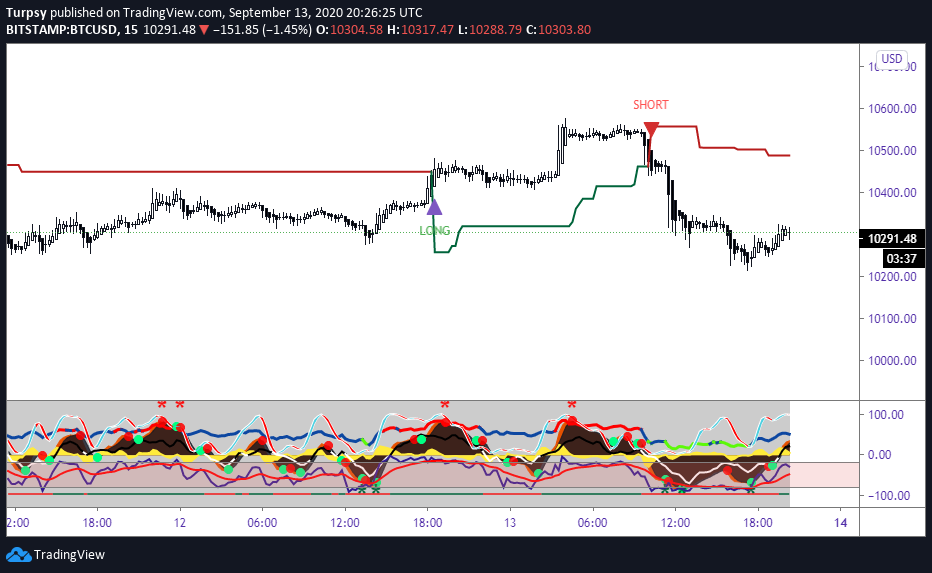
https://www.tradingview.com/x/6mFOTHSi/
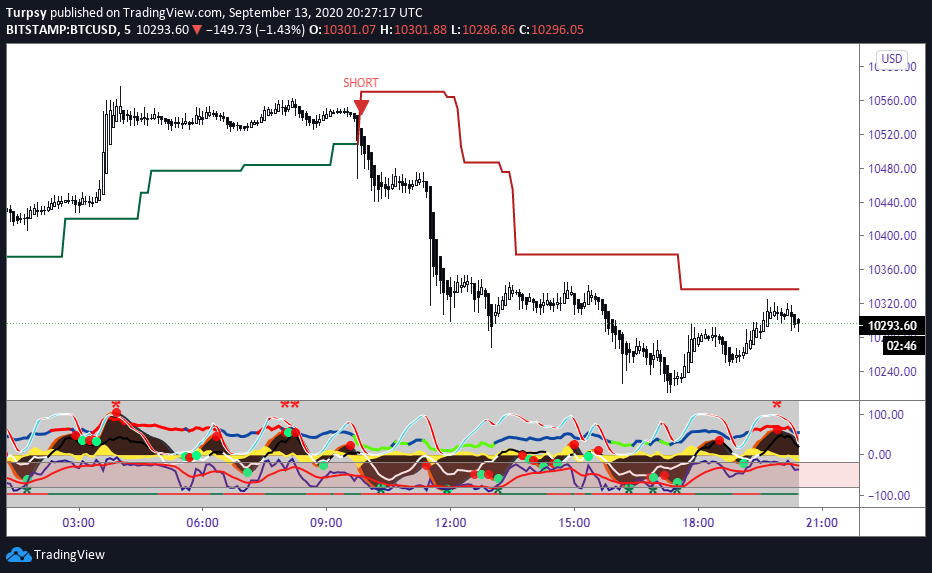
https://www.tradingview.com/x/X76YgxaR/
Summary:
4hrs ST is short
1hr ST is short
30 mins ST is short
My Position
I will be waiting for 4 hrs trends to indicate the perfect trade.