The thing about technical analysis is the more history you have the better you are able to forecast potential price targets and reversal.
This is simply because there is a history at those levels. A spot where buyers or sellers missed out or got burned and will likely look to act if price gets there again.
Building Price History
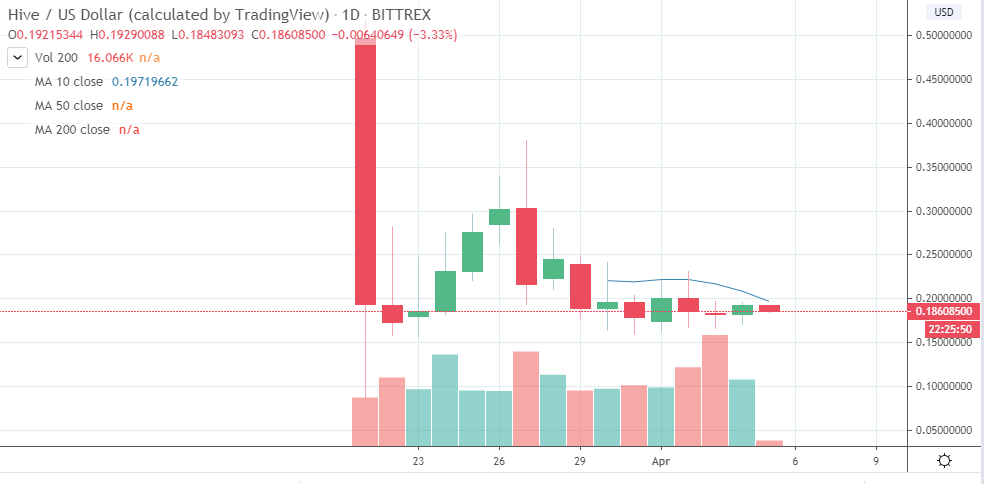
Hive is just starting to build a price history, but what I can tell you is this sideways action could become a base and it is better that price doesn't drop below it.
If it does then visiting the opening day low is on the table.
Here's the thing - the opening day of trading IS THE CURRENT PRICE RANGE for Hive.
So that is what I will keep my eye on as the high and the low until more develops.
Do you know how do you get the volume to show on the right-hand side of your charts?
I don't I've always looked at it on the bottom.
What does the weekly chart look like? 😁😁