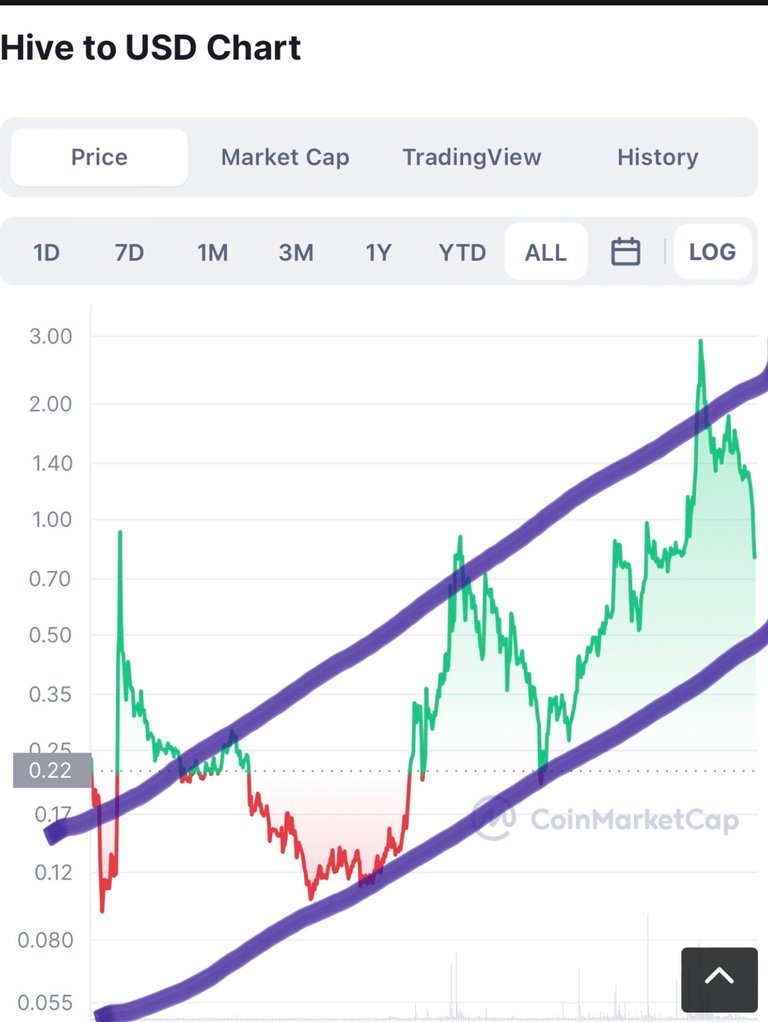
I do not have too much to say about this chart, but I did find it interesting. This is an all time HIVE graph in log scale. If this graph means anything (which it probably doesn’t), then the next low will be ~$0.50 to $0.60 range.
I do not have too much to say about this chart, but I did find it interesting. This is an all time HIVE graph in log scale. If this graph means anything (which it probably doesn’t), then the next low will be ~$0.50 to $0.60 range.
Looks like 45 cents according to that chart. I would possibly buy at 45 cents, but no higher.
I don't know much about these charts and trading but from what I'm seeing here, it looks the price has started going high. Should that be the end of the bear market?
Waiting the update on the current crash :S