RSI indicator is one of the simple and most important indicator. It's really a great indicator for trading. Many big traders use this indicator. RSI means Relative Strength Index. It is a momentum oscillator. Which measures the speed and change of price movements.
Today I will try to make you understand the RSI indicator and and show you the simple ways to use RSI in trading. So let's begin.

This is what RSI looks like. A line goes up and down. There are some numbers to the right. It starts from 0 and ends at 100. But we only need 30 to 80 for simple purposes.
Overbought
When the line of the RSI comes close to the 70 line or cross it from below, that means the share or coin is overbought. If people buy more than selling, then in that situation we call it overbought. When a share or a coin became overbought then its really a risky time to hold the share or coin. Because when there is more buyer than seller the price will automatically increase. So now the price is really high. But when in overbought situation the shareholders or the coin holders start to sell the the share or coin, then they don't get any buyer and they start to sell the share or coin in low price. There is an example in the image below.
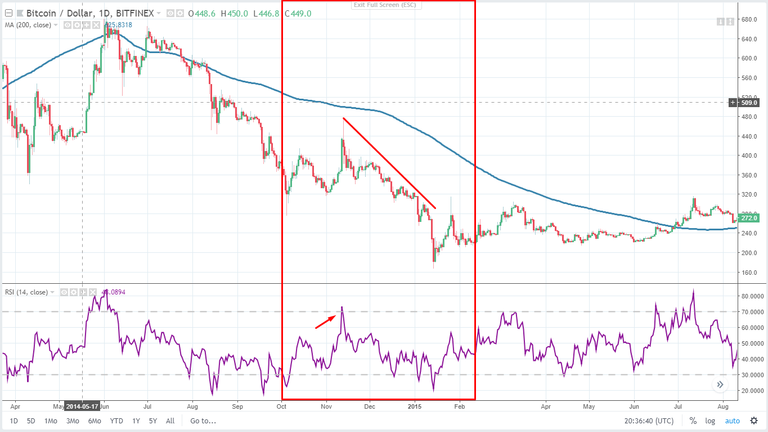
In this image you can see that the RSI line cross the 70 line from below. In that point it is overbought. And you can also see that, the price started to fall the after the overbought.
Oversold
When the RSI line come close or cross the 30 line from above we call it oversold. Oversold mean when coin holders sell their coin or share for low price and there are more seller then buyer. When a share or coin indicate for oversold it's also indicate to buy.
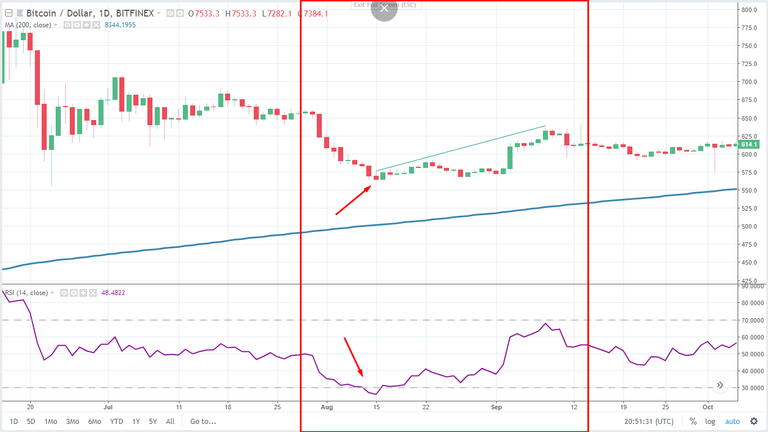
In the image you can see a oversold position.
Warning
Now I want to tell you that do not buy or sell on oversold or overbought. Because it maybe a false signal. So don't become over confident. And make a mistake. There are lots of things we have to learn about RSI.
RSI Divergence
Now we have to know about RSI divergence. RSI divergence is really important in trading. There are two type of divergence. Regular Divergence and Hidden Divergence. In this post we will only discuss about Regular Divergence. And we will discuss about Hidden Divergence in the next post.
Divergence
Divergence is a reversal signal. Mainly if a market is in uptrend then it will give you the downtrend signal or if it is in downtrend then it will give uptrend signal.
Bearish Divergence
In a uptrend when candlestick is showing a uptrend but the RSI showing a downtrend then a bearish Divergence happens and the market will go downtrend. Just see the image it will become more clear to you.
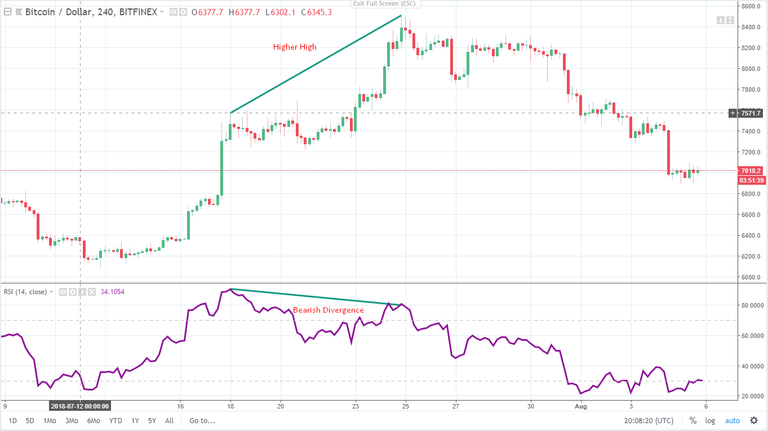
In the picture you can see what I meant to say. The RSI line must be close or above to the 70 line.
Bullish Divergence
In a downtrend when candlestick is showing a downtrend but RSI line is showing a uptrend then a bullish Divergence happens and the market will go Uptrend. Let me show you in the image.
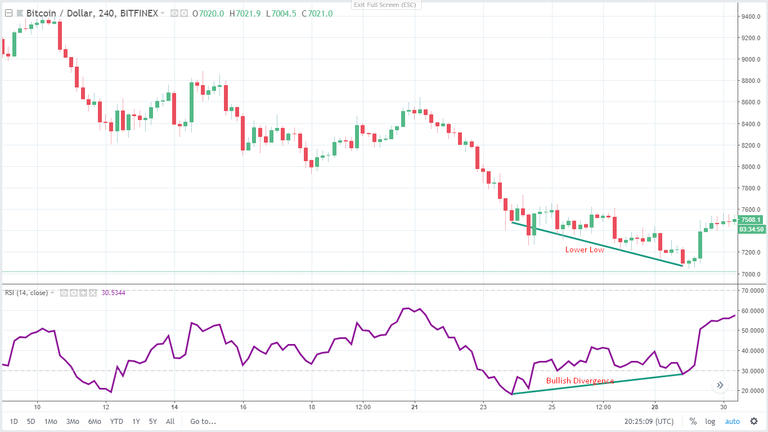
The RSI line must be close or below to the 30 line.
Warning
Sometimes in strong downtrend or in a strong uptrend Bullish and Bearish Divergence can't reverse the trend. So be careful. And I will give you all the Other system about RSI in my next post.
So if you like my post then please like it. And if you have any question then comment. Follow me for my next post about RSI.