WARNING: This might be boring, but you'll probably learn something about charting. I go into more detail in this article to explain each element of the upcoming trade.
To make money on the markets, identify the long term trends that are established and trade with the trend. Current trends that are clearly bullish include Stocks and Oil.
Stocks have been in Bull mode since 2008 and will continue this trend until there is no more hedging and everyone is all in... aka no more buyers - We are not even close to this as numerous funds and managers are still short hedged including big names like Icahn. Even if Trumphoria wears off, there is way too much liquidity sloshing around for stocks to drop. The FANGS have raised the market indicies with the help of the Mutual Fund 'epidemic', but everything else still has plenty of room for price growth.
Oil has been in an uptrend since the bottom in summer 2016 with the ''oil glut'' and that is what EVERYONE was talking about at the time. Banks were over-invested and about to go bankrupt if oil stayed low any longer. It was at this time that I had to make the choice: Short Banks heavily invested in Mid-west American Oil/Gas..... or buy Oil. Contrary to what everyone was feeling at the time (calling for 20$ oil), I came to the conclusion that the powers that be would not allow these banks to go under, and I recommended buying Oil, which turned out to be a great decision! (You can read back to some of my earlier Steemit entries to see this call.)
Oil Today
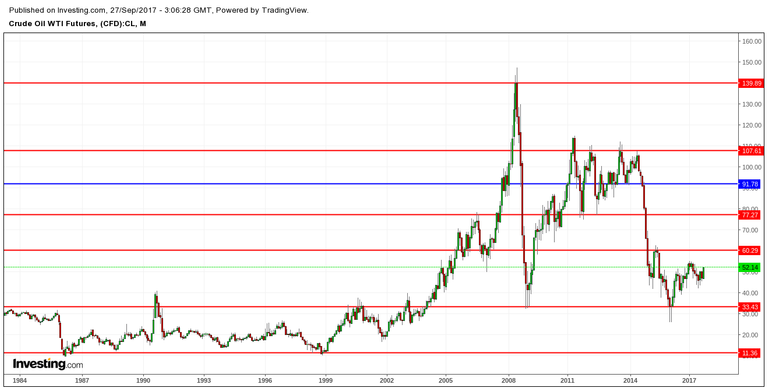
Here is a quick look at the long term chart support and resistance lines.
And here is a look at our Daily chart between those larger long term levels.
.png)
I find it to be VERY RARE for prices to change directions without touching a previous MAJOR support or resistance level. With this in mind, my original call (August 2016) was Oil 60$. You can see on this chart that we are well on our way to this target. This is further supported by the fact that price has respected all of the in-between fibonacci levels (bouncing around from one to the other).
Short Term Expectations:
I expect some sort of economic or political event in the next two weeks to rapidly drive oil up to 60$. Given the recent hurricane season, the economic driver could be decreased oil production out of the Gulf. The Political driver would be Trump's Twitter account.Long Term Play:
Once we hit 60$, everyone will be talking about bullish oil (and probably bullish commodities, as gold breaks higher, as well.) However, with everyone buying into the 60$ oil story, this will most likely mean a drop in oil prices. I will expect a drop down to at least the 23% fib level at 53$ and likely the 38% fibonacci level at 48$ (as marked on the chart above). During this time, you will hear Fundamental news indicating 'oversupply' and increased Gulf production. I will be looking to short oil at 60$.Fundamentals vs. Price Action
I've made some pretty specific fundamental calls here out into the future. I often find that fundamentals, whether ''good'' or ''bad'' for the market in discussion, will only further the current trend or reversal off S/R levels. Let's see how this plays out.
-JTtheAT
Enjoy! Like, Comment, Share and feel free to tip me with BTC. Thanks.