US job reports gives clues about market tops. Hedging trades in oil and US Dollar. Bitcoin rejects $10,000 (for now)

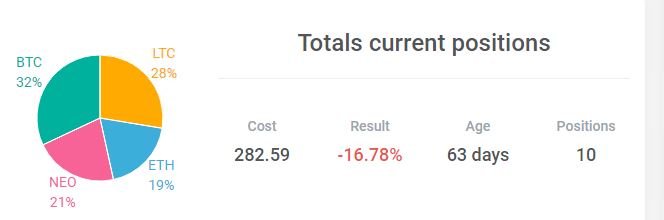
Portfolio News
US Jobs Report US Jobs report came in with lower job hiring than expected.
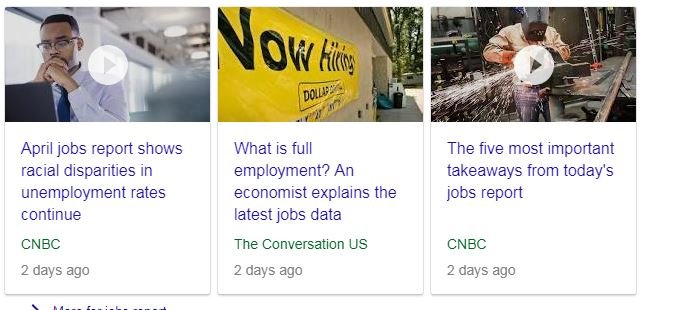
The market reaction was muted as the detail of the report hides key movements - unemployment rate is as low as it was in 2000. Average wages did rise by more than the inflation rate - the pressure cooker will start to cook on wages unless there is a change in the participation rate (currently low). This article highlights 5 factors to consider - they all suggest to me that this growth phase still has some legs but there will be market bumps as we progress. The question is for how much longer?
- Job market is doing fine, wage gains remain tepid
- Factories are hiring and struggling to fill robust orders
- Hiring, growth in service industries is a bit cooler lately
- The trade gap narrowed but tensions with China remain
- Productivity still isn’t going anywhere fast
There is a flipside concern in this article that the re-emerged correlation between rates and the US Dollar could be signalling upcoming problems
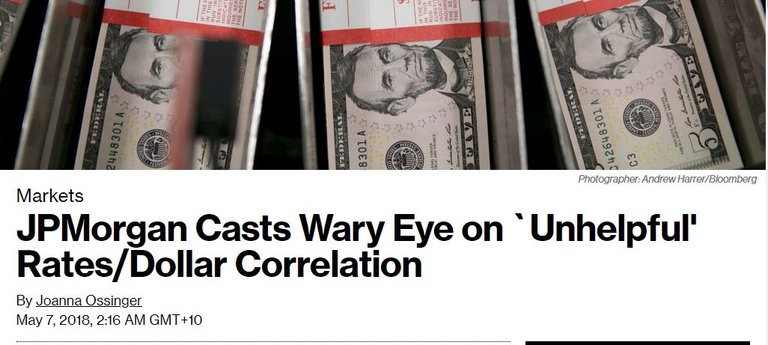
Global markets continue to signal more risk than opportunity this spring despite impressive earnings, with widening credit spreads and a near-total retracement of 2018 losses by the trade-weighted dollar
This is a challenge for reading market tops. Some signs come along to warn about the turn but a lot of the other signs say all is doing just fine (until it is too late)
Argentina Argentina has had a checkered history when it comes to managing inflation. They are back at it with the central bank raising interest rates to an eye-popping 40% to halt the decline in the Argentinian peso.
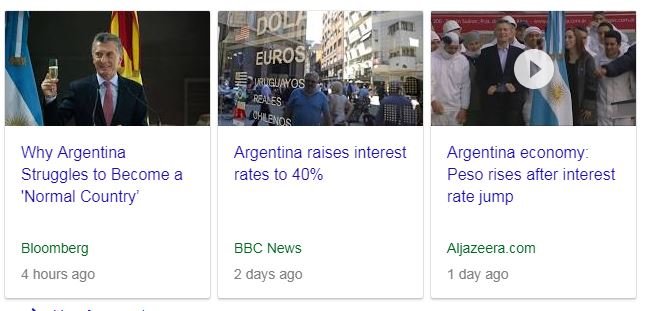
The loss of policy credibility is perhaps the simplest and most direct explanation for Argentina’s predicament
Followers of the 56 percent Club will know that Argentina is a member of that club with a 55.5% return since I bought in July 2016 when nobody else was buying. I will sell my holdings when markets open tonight to lock in some of those gains (now down to 45%)
Bought
I read an article on Real Vision which pointed to the difficulty of reading market tops. One of the things they said has been a reliable way to trade into the tops is to watch commodity prices continue to rise after the downturn signals begin and the US Dollar strengthens. One way to trade then is to go long commodities - they choose oil and to go long the US Dollar. I am already long US Dollar against the Swiss Franc and the Chinese Yuan.
The suggestion from Real Vision was to use the Oil Producers ETF (XOP). I added positions to the following two oil stocks in two of my portfolios. I already hold them in my pension portfolio. So far it is only 1% of the portfolio. I will watch the price action and look to move to a 5% exposure . I was encouraged to see in the JP Morgan article above that they were leaning the same way using oil as their commodity hedge (JP Morgan are moving to 3%).
Antero Resources Corporation (AR): US Midstream Oil Producer. Added to one portfolio as Midstream play on oil. See TIB219 for the rationale.
SPDR S&P Oil & Gas Exploration & Production ETF (XOP): US Oil Producers. Added 1% position to two of my portfolios.
Boardwalk Pipeline Partners, LP (BWP): US Oil Pipelines. The pipeline stocks I bought last week had taken a bit of a hit. I averaged down the entry price on this one to bring up the size of my position. Looking at Friday price action this may have been the wrong choice - it went down some more.
Sold
iShares Europe ETF (IEU.AX): Needed to raise some cash in my Australian portfolio to fund pension commitments. Consistent with what I have been doing, I closed out top level Europe positions for a focus down in specific sectors (principally financials and banks). 21% profits since February 2016.
Shorts
Euribor 3 Month Interest Rate Futures (IZ0). I have been trading this mostly using futures. I added in a March 2020 strike 99.875 put option for €0.145 net premium. Premium is a little more than one rate hike which is the amount that price has moved up in the last few weeks. If price goes back to the levels that have already been tested in the last 2 months, the premium will feel like a free trade.
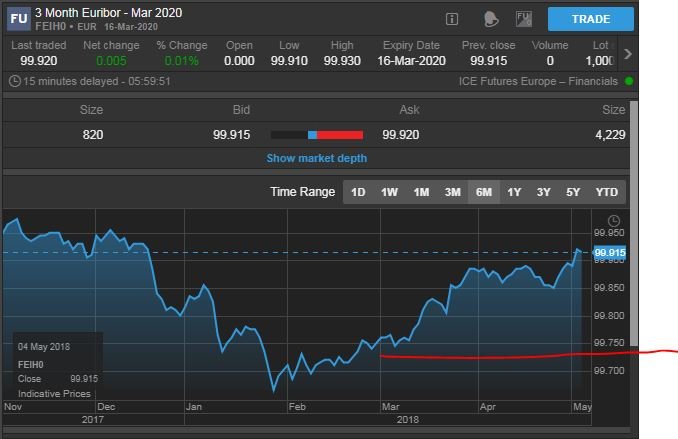
The red line shows breakeven for the trade - I want price to go down. With just under 2 years to go, I am comfortable
Cryptocurency
Bitcoin (BTCUSD): Price range for the weekend was $573 (5.7% of the high) for below average volatility. Price did pass $10,000 on some exchanges but has since rejected that level and dived back into the middle of the channel in Monday trade.
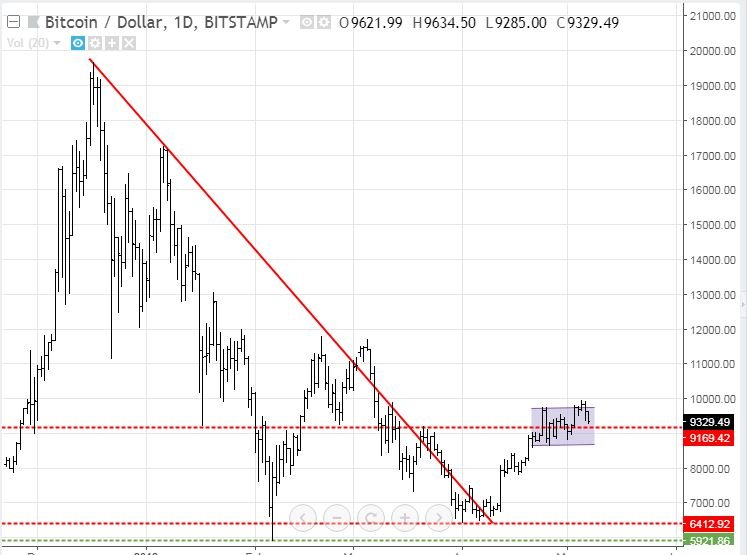
There is an important support line, which has been respected in the past few months a few times going down and up, running just below the current price. We really need price to respect that level before we can safely say that price will break up.
One of my trades in my IG markets account hit its take profit target at $9895 for a $776 (8.5%) profit.
CryptoBots
Outsourced Bot Bot closed 2 trades on BTG (1.47%) and LTC (1.57%) for 196 closed trades in total. Problem children (>10% down) list had some changes with ADA and ARK joining the list.
The current list is now (14 coins) - ETH, ZEC, DASH, ADA, PPT, DGD, ENG, GAS, NEO, ETC, QTUM, BTG, ADA, ARK
This robot runs with a 20% performance fee on profits - currently there are no profits to warrant a fee.
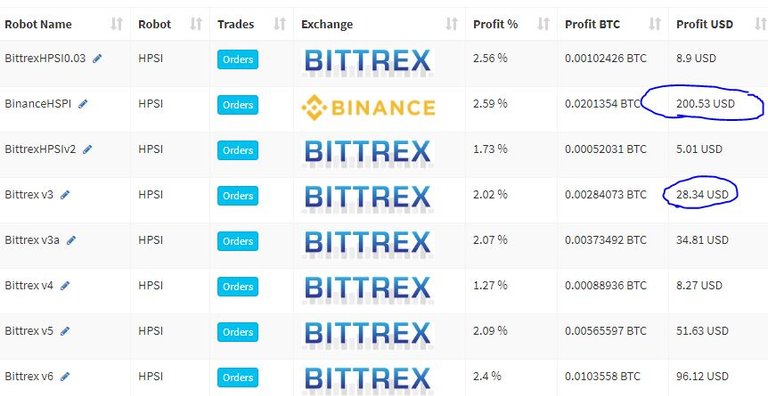
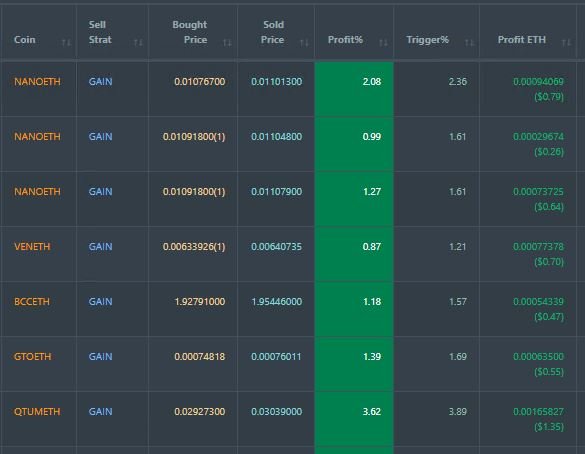
Profit Trailer Bot Overall the bot closed 7 trades for an average profit of 1.63% bringing overall loss on 214 closed trades to -0.57% (was 0.67%) of total balance. I have restricted DCA to one level - 3 trades came from one level of DCA.
Dollar Cost Average (DCA) list was unchanged with all trades doing worse.
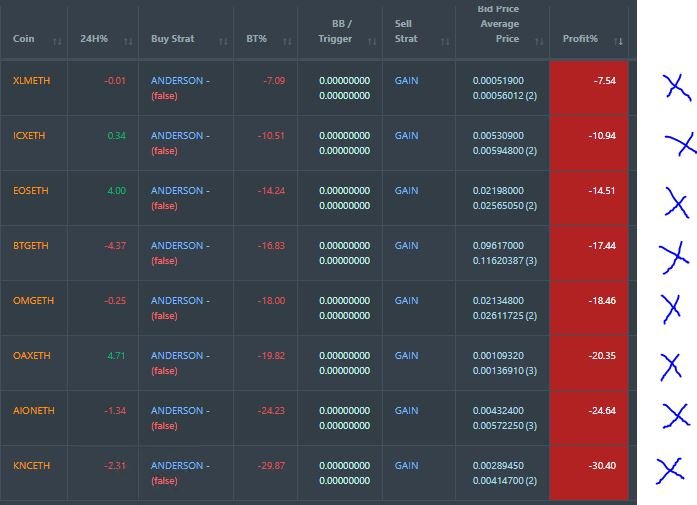
The strong rise in Ethereum price has made a big hit on the altcoins in the same way we saw with Bitcoin pairs. This move highlights the problems of using trading robots which do not do well well when market conditions change. One really has to find ways to identify the changes before the damage is too deep and switch off the robot until conditions stabilize. The Sell Only Mode trigger does help to mitigate some of the damage but not enough in this case.
First cut look shows that adding up the negative levels is 142% down. With 214 winning trades averaging a little over 1% one would think that the robot is OK. Wrong!! To assess the real extent of the damage one has to take the % down figure and multiply that by the levels of DCA - then add them all up to see if the losses would be covered by the wins.
Maybe a better strategy is to not run DCA at all and introduce a stop loss level - say 10%. In this case there would be 7 trades that would have stopped out at 10% = 70% in total which compares fine with 214 winning trades over 1% each.
The challenge is going to be how to get the robot to implement that without stopping out the existing trades. These will have to trade out. I will have to set manual sale orders for those at breakeven and exclude the robot from trading them until they are cleared.
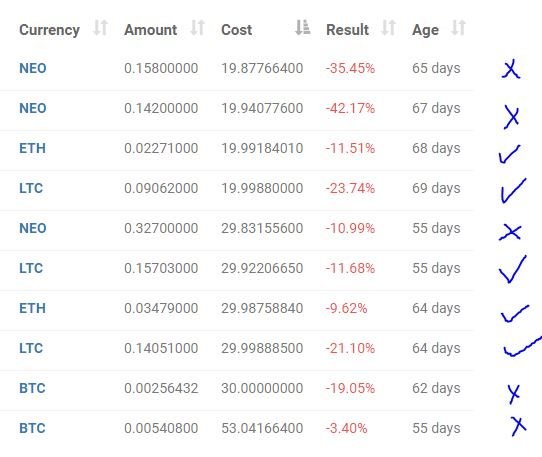
New Trading Bot Overall trade positions are down 17% (was 18%). Bitcoin position did trade into positive territory over the weekend. I will most likely keep onto that position as I am happy to be long BTC and ETH.
NEO and BTC traded worse over the weekend
Currency Trades
US Dollar (EURUSD): I ran a quick review of opportunities to go long the US Dollar. With rising commodity expectations (especially oil) it does not make sense to use Canadian Dollar or Australian Dollar. Swedish Krone had higher implied volatility that Euro or Swiss Franc. The Swiss Franc chart has already moved to prior highs. Hence, I chose Euro which has confirmed the reversal down. I bought 12 month to expiry strike 1.965 put options for €0.019 premium. Lets look at the chart which shows the bought put (1.1965), breakeven, 100% and 200% profit as red rays with the expiry date the dotted green line on the right margin.
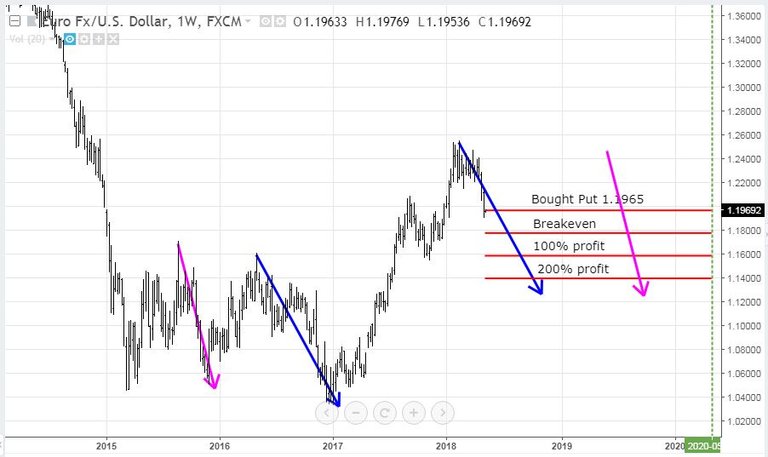
Breakeven is at the last mini reversal and 100% is at the level of the reversal before that. If price replicates the drop seen in 2016 (left hand blue arrow), the trade will comfortably make 200% profit. The prior drop (left hand pink arrow) was for the same amount but was much steeper. Either pink or blue works for me and there is time for a little sideways action too.
Forex Robot did not close any trades and is trading at a negative equity level of 16.7% (lower than prior day's 17%) - inching in the right direction..
Outsourced MAM account Actions to Wealth closed out 2 trades for 0.13% profits for the day.
Cautions: This is not financial advice. You need to consider your own financial position and take your own advice before you follow any of my ideas
Images: I own the rights to use and edit the Buy Sell image. News headlines come from Google Search and Bloomberg.com. All other images are created using my various trading and charting platforms. They are all my own work
Tickers: I monitor my portfolios using Yahoo Finance. The ticker symbols used are Yahoo Finance tickers
Charts: http://mymark.mx/TradingView - this is a free charting package. I have a Pro subscription to get access to real time forex prices
Bitcoin: Get started with mining Bitcoin for as little as $25 http://mymark.mx/Galaxy
May 4, 2018
Great article again - a timely reminder to offload some of my IEU also. I sometimes need to remind myself of the rules that I set when purchasing stocks - which is to pay myself back when the opportunity presents itself.
One of my lawyers taught me that rule - Use OPM - Other People's Money. He was a master at it - that is why I fired him.
The challenge with Europe is that the economies are still growing which means that there could still be upside. The European index is dominated by banks and financials and manufacturing. When interest rates rise, banks will do better. If the US Dollar story is right Europe manufacturing will benefit from a weakening Euro. I would be holding back some to grab that advantage. This is what I am doing in my overall portfolios.
Upvoted ($0.13) and resteemed by @investorsclub
Join the Investors Club if you are interested in investing.
muy interezante tu articulo en realidad esto de los $ son temas que deberian de interesarnos ya que esto repercute en todo ambito de nuestras vidas.
si no prestamos atencion a todas estas noticias como defenderemos nuestros derechos es algo para meditar excelente aporte @carrinm te felicito por tu publicacion
Thanks - important it is especially when Central Banks can change it all in a hurry
Thanks @carrinm for valuable information
best regards bapak @carrinm
let me follow you.
Outstanding post. I agree with going long oil..my target is $80.
I missed the Euro short because my target as 1.28. However, the dollar is approaching many supply zones.
PS - how do you like Real Vision, thinking of subscribing now that they reduced the subscription fee?
I have subscribed to Think Tank - at full price. I prefer written material rather than video. At the new price it will be easy to generate $180 worth of value a year.
Edit: EURUSD chart. Expiry is April 26, 2019 - not 2020 as shown on the chart