Markets stumble on China, again. A busy expiry season with assignments helping to add cash to portfolios. Trade action shifts more domestic in Japan, adding to marijuana and taking another look at shorts in South Africa and High Yield Debt.

Portfolio News
Market Flip Flop
US market looked like it wanted to trade strongly with a solid open.

First thing I check in the morning are my open cryptocurrency, interest rate and commodity positions in my CFD account. That gives me a sense of what is going on. I saw a tweet from Jim Cramer
"Alright, what the heck just happened?" The chart told me the story - a collapse in soybean prices.
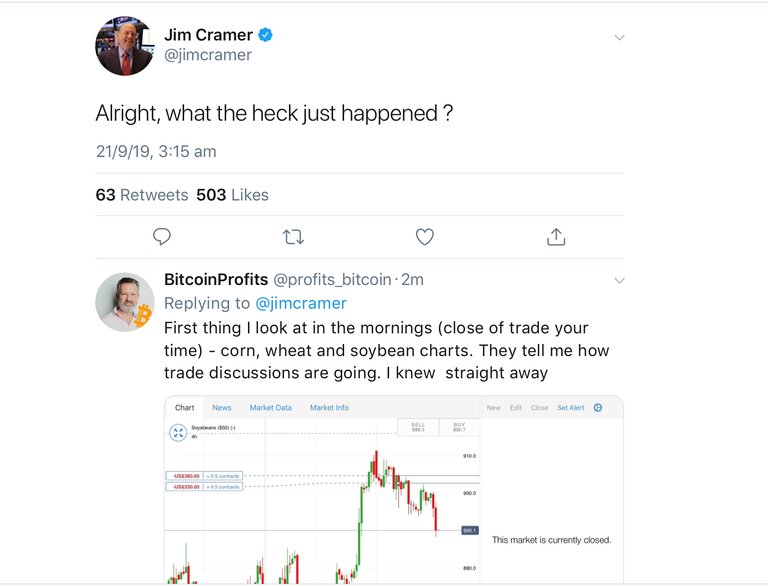
I was guessing the China trade discussions just had a turn for the worst. Not sure what but it could not have been good. And I was right, the China agriculture delegation chose to skip a visit to Midwest farms and went home a day early
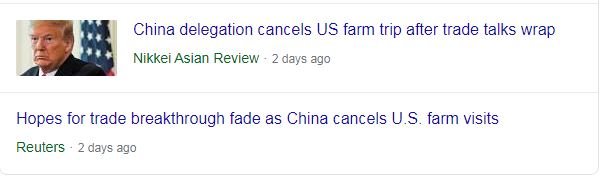
Now I am learning to take headlines with a degree of scepticism. That is what I saw on Saturday.
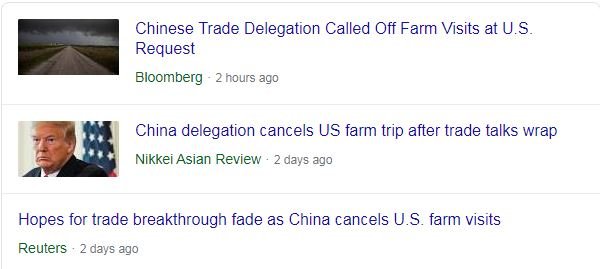
This is what shows up 2 hours ago. It seems the US called off the visits. Either way soybeans price took a bash. If the 2 hours ago headline is right, soybeans price will go back to where it was.
One story that is not going away is the liquidity crunch the Federal Reserve is propping up.
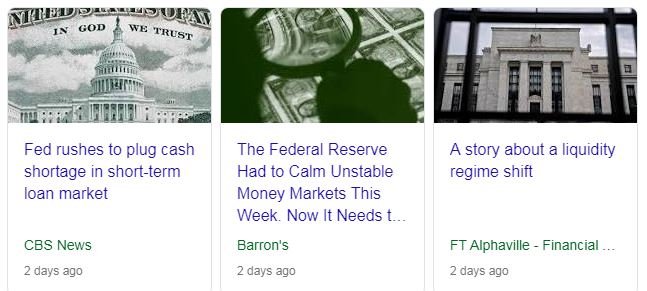
This was supposed to be a temporary shortage caused by a coincidence of tax and coupon payment dates.
Maybe it is something else. The Federal Reserve has shrunk its balance sheet by $750 billion = cash out the system. US Treasury has raised its borrowing to fund the deficit (getting towards $1 trillion) = cash out the system. Add in primary dealer and hedge fund demands on repo markets, there is a liquidity crunch that is a bit more than the timing of tax and coupon payments. Read about it here in more depth
Bought
Canopy Growth Corporation (WEED.TO): Canadian Marijuana. Completed averaging down prices in pension portfolio on each of the Canadian listed stocks I am holding. I will review US listings during the week on Tilray (TLRY) and Cronos (CRON)
Vital KSK Holdings Inc (3151.T): Japan Pharmaceuticals. Picked from a Price to Sales screen.
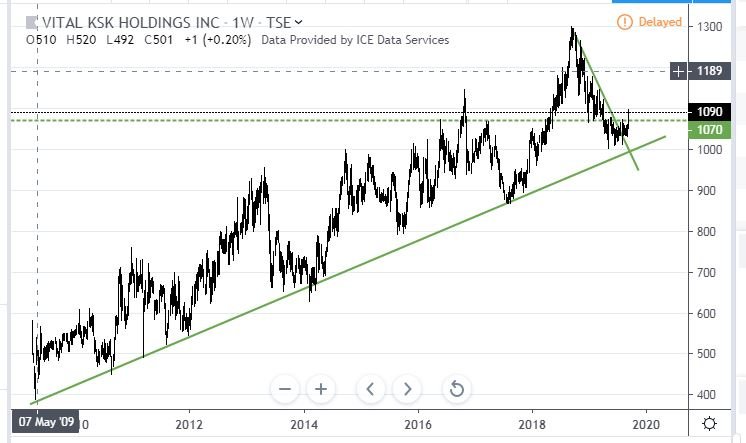
Chart is showing steady cycles from the 2010 lows and could be starting a new upswing off the trend line. For 2019, price has broken the downtrend and cleared the high for the last but one cycle up (dotted green line)
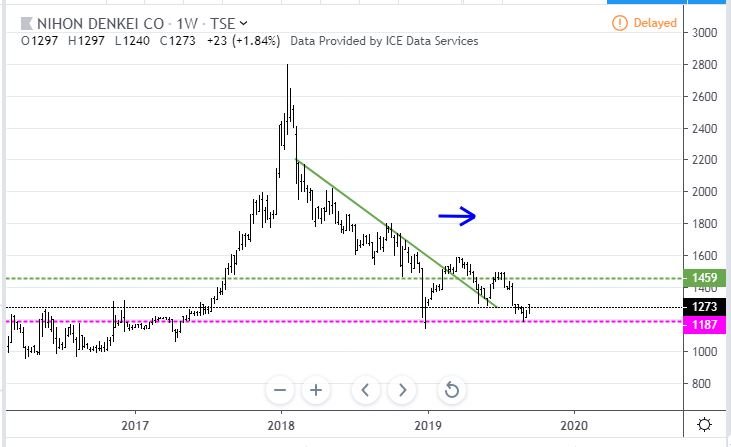
Nihon Denkei Co. Ltd. (9908.T): Japan Industrials. Previously picked on a Price to Book and Price to Sales screen in another portfolio (see TIB384) where the blue arrow begins. Price did break the uptrend and then retraced - now looking for a bottoming formation off the dotted pink line.
Sold
Osaka Titanium Technologies (5726.T): Decided to take profits and switch to alternate Japanese stocks that are more domestically focused. 7% profit since August 2017 - a big casualty of tariffs and also likely to struggle if Boeing (BA) troubles persist much longer. For now, Boeing continues production BUT it cannot go on forever if there is no clearance soon for the 737 Max to fly.
Covered Calls Assigned
A slew of sales from stocks assigned against covered calls. A quick reminder on the process. I write covered calls on stocks I am happy to sell. I choose a 5% coverage ratio for profitable holdings and 10% for unprofitable holdings. I figure a 10% move in a month is a strong indicator for an exit. I do buy back occasionally. For each sale I report the capital gain/loss and the cumulative income from writing covered calls.
Applied Materials, Inc (AMAT): US Semiconductors. 8.3% blended profit since March, July, August 2018 and April 2019. Income from covered calls added 5.6%
Bank of America Corporation (BAC): US Banks. 117% profit since June 2016. Income from covered calls added 2.5%
Citigroup (C): US Banks. 5.8% profit since August 2019. Income from covered calls added 0.4% (first trade). I will rebuy Citigroup (C) as it is on Jim Cramer buy list below tangible book value.
iShares MSCI Germany ETF (EWG): Germany Index. 0.6% loss since February 2019. Income from covered calls added 0.7% (just profitable). Feels like a lucky escape given the 2nd quarter of negative GDP growth in Germany
iShares Taiwan Index (EWT): Taiwan Index 16% profit since August 2016. Income from covered calls added 2.9%
iShares South Korea Index (EWY): South Korea Index. 5% profit since August 2019. Income from covered calls added 0.4% (first trade). In another portfolio, averaged down this position rather than buy back calls. 3% blended loss since August 2018 and August 2019. Income from covered calls recovered 0.6%. South Korea will be a beneficiary of the resolution of the China trade war.
Fluor Corp (FLR): Oil Services. Averaged down this position rather than buy back calls. 51% blended loss since April 2016 and September 2019. Income from covered calls recovered 3.6%. The Saudi oil fields attack drove this sector higher really strongly (+8.76% move) = not what I was expecting.
Kraft Heinz Group (KHC): US Packaged Goods. Averaged down this position rather than buy back calls. 13% blended loss since February and September 2019. Income from covered calls recovered 3.5%. I am figuring between the dividend yield and the covered call writing I can recapture a large slice of the capital loss.
SPDR S&P Insurance ETF (KIE): US Insurance. 12% blended profit since March and May 2018. Income from covered calls added 1% (first trade). It is time to dig a little deeper into the insurance sector for opportunities. I am exposed to American International Group (AIG)
SPDR S&P Oil Explorer/Production ETF (XOP): US Oil Production. 33% blended loss since November 2017, February 2018 and April 2019. Income from covered calls recovered 7%
Commerzbank (CBK.DE): German Bank. 33% loss since July 2018. Income from covered calls recovered 8%. I chose not to buy back these calls as I am holding another parcel of stock at a similar price - I might buy the stock again this week and keep writing. In another portfolio where I did average down, 10% blended loss with 12% income recovered (i.e., better than breakeven).
Apache Corporation (APA): US Oil Production. Averaged down this position rather than buy back calls. 26% blended loss since April and September 2019. Income from covered calls recovered 3%. I did sell a September 27, 23.5 put option to grab back some premium, In another portfolio, 26% loss and 2.7% recovered income
3D Systems Corporation (DDD): 3d Printing. 29% loss since March 2019. Income from covered calls recovered 12%. Sure was not expecting this stock to rise 17% in 4 weeks.
FireEye (FEYE): US Cybersecurity. 27% profit since February 2017. Income from covered calls added 18%. In another portfolio, 5% blended profit and 22% income. Looks like a good stock to buy back to write covered calls.
Wisdomtree Japan Small Cap ETF (DFJ): Japan Index. 54% profit since August 2012. Income from covered calls added 3.8%. This closes out the longest held stock in the portfolio.
iShares MSCI Mexico Capped ETF (EWW): Mexico Index. 16% loss since August 2018. Income from covered calls added 0.24% (first trade). Trade based on rising oil prices - momentum snapped with US tariffs spat and then oil prices sagged.
Sunrun Inc (RUN) Solar Power. 2.8% profit since June 2019. Income from covered calls added 2.9% (first trade). Holding replaced last week with Jingko Solar (JKS)
Shorts
iShares MSCI South Africa ETF (EZA): South Africa Index. Averaged down my short position with January 2020 48/40 bear put spread - closing price of $50.12. Average net premium is now $2.48 bringing maximum profit potential up to 223% if price drops 25% from here. Quick update of the chart which shows the new breakeven as a fluoro green ray.
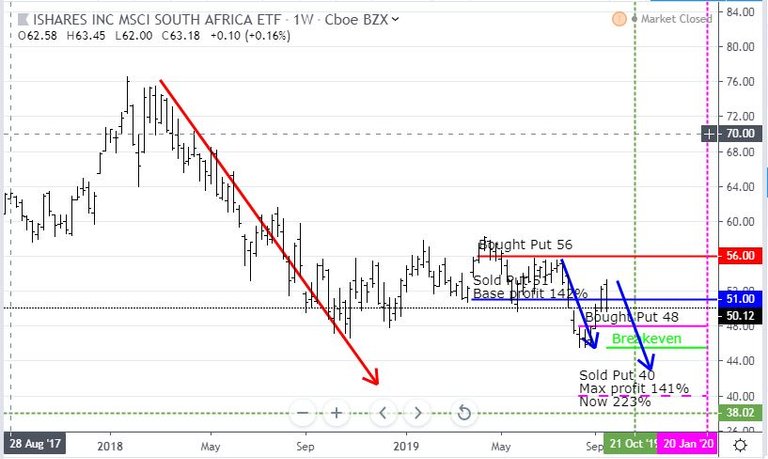
That brekeven is at the level of the lows of the last cycle lower. I have modelled a price scenario (blue arrow) based on that last cycle down. Get a repeat of that and the new trade will go past breakeven comfortably. It will need a little more to make the maximum
iShares iBoxx $ High Yield Corporate Bond ETF (HYG): US Interest Rates. Averaged down my short position with November 2019 86/80 bear put spread - closing price of $87.48. Average net premium is now $0.43 bringing maximum profit potential up to 1295% if price drops 9.5% from here. Quick update of the chart which shows the new 100% profit as a fluoro green ray.
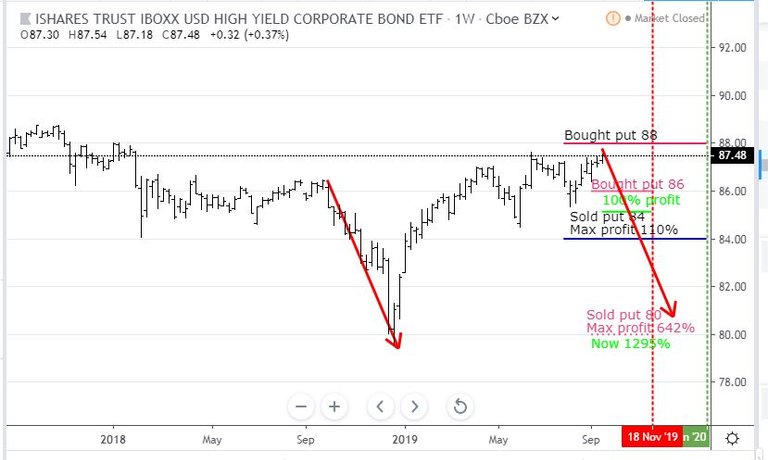
That 100% profit is at the level of the lows of the last cycle lower. This trade is going to need a big price move steeper than we saw in the last 2018 cycle down. Even that will only take the trade part of the way. What it will do is make the longer expiry trade a winner (the red/blue ray combination). A small cycle lower will work just fine to get to 100% and price could just be forming a double top or even a head and shoulders. More bad news from oil sector and this could move.
Expiring Options
Yamana Gold (AUY): Gold Mining. Strike 4.5 sold call expired. I had sold this call option to convert a January 2021 strike 4.5 call option trade to a calendar spread. I needed price to stay below 4.5 strike to expiry in September which it did. (See TIB459 for the details)
VanEck Vectors Gaming ETF (BJK): Gaming. Closing price of $37.30 leaves a 38/41 bull call spread expiring worthless - total loss. Trade set up to give more time for gaming revenues to move based on a key takeover catalyst (REI of CZR). (see TIB442). The trade ran out of time with price only once touching above $38 in the last month. Quick update of the chart - all I have added is a blue (dotted) price arrow cloned across.
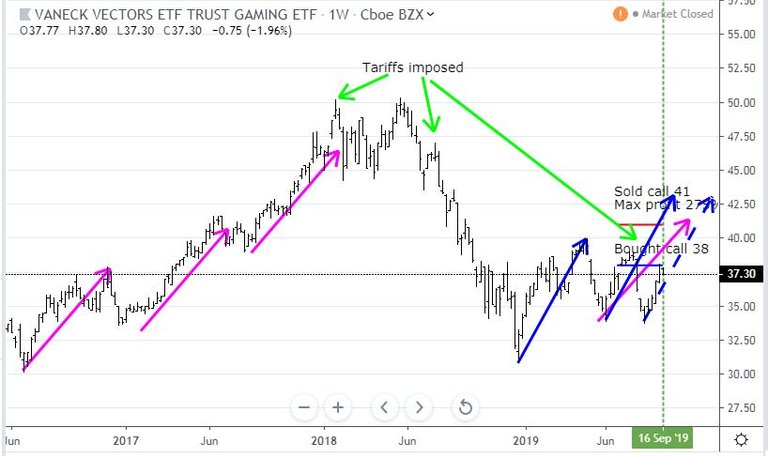
Price has been penalised by each round of tariffs announcements. The last round was postponed by two weeks and price started to move again on a blue price arrow scenario. Trade ran out of time and I did not make the adjustment to find more time. I am holding the stock in one portfolio - I will hold on and not have time working against me.
Cisco Systems, Inc. (CSCO): US Technology. With closing price of $49.60 strike 55 call options expired worthless. I did claw back some of the premium by selling strike 52.5 call options after the initial trade. Those expired in my favour. This trade was part of a August/September calendar spread ahead of earnings - the front sold leg expired in my favour (see TIB452 for the detail) giving an effective 74% loss.
NIKE, Inc. (NKE): US Consumer. With closing price of $86.68 strike 77.5 put options expired worthless. This trade was part of a July/September calendar put spread - the first leg expired in my favour giving an effective 51% loss.
Electronic Arts Inc (EA): Video Gaming. With closing price of $98.70, 100/105/75 call spread risk reversal would have expired out-the-money. I had sold the 100 strike calls earlier in the week to recover some capital. The outstanding short 105 call options and 75 put options expired in my favour yielding a small net loss of 18% ($34) . See TIB473 for the chart update when I closed out the 100 strike call options.
Hedging Trades
All 3 sector hedging trades expired without reaching the start of the spreads. The design of the hedges is to cover a drop in the market between 5% and 10% - i.e., not a small drop less than 5%.
Vanguard FTSE Europe Index Fund ETF (VGK): Europe Index. Closing price of $54.22 leaves a strike 52/49 bear put ratio spread expiring for 19% net loss - never unhappy when a hedging trade loses. In another two portfolios, I had set up a 48/46 bear put spread - expired worthless - effective 54% loss (i.e., not a ratio spread)
Invesco QQQ Trust (QQQ): Nasdaq Index. Closing price of $190.80 leaves a strike 182/173 bear put ratio spread expiring for 2.3% net loss
SPDR S&P 500 ETF (SPY): US Index. Closing price of $298.08 leaves a strike 282/269 bear put ratio spread expiring for 3.7% net loss
Income Trades
Busy covered call writing season ends with lots of assignments. I did review buying back more BUT felt this was a strong market driven way to raise cash across my portfolios.
In pension portfolio, 10 stocks assigned, 2 more bought back, 21 expiring worthless. Bought back covered calls on following stocks which brought the average monthly premium - from 0.96% (after prior buy backs) down to 0.93% - still acceptable.
- Randstad (RAND.AS): Europe HR services
- BNP Paribas (BNP.PA): French Bank.
In another portfolio, 5 stocks assigned, and 6 expiring in my favour.
In a third portfolio, 6 stocks assigned, and 4 expiring in my favour.
Naked puts
- Honeywell International Inc. (HON): US Industrial. With closing price of $168.31, short 155 strike put option expired in my favour.
Cryptocurency
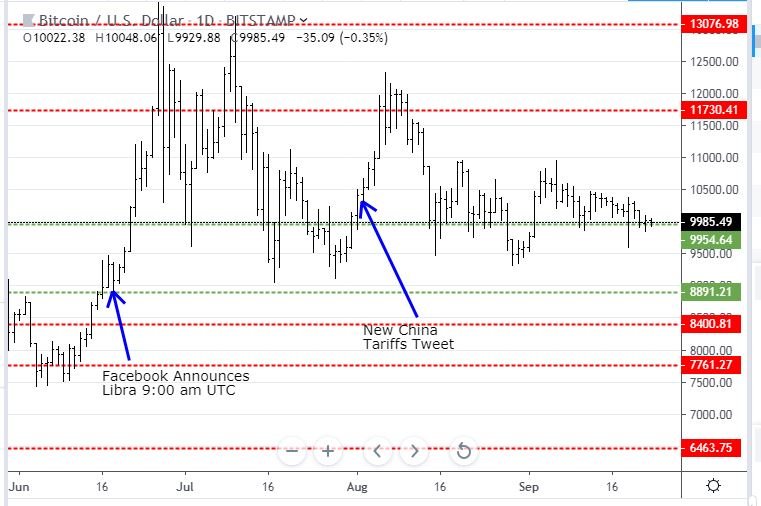
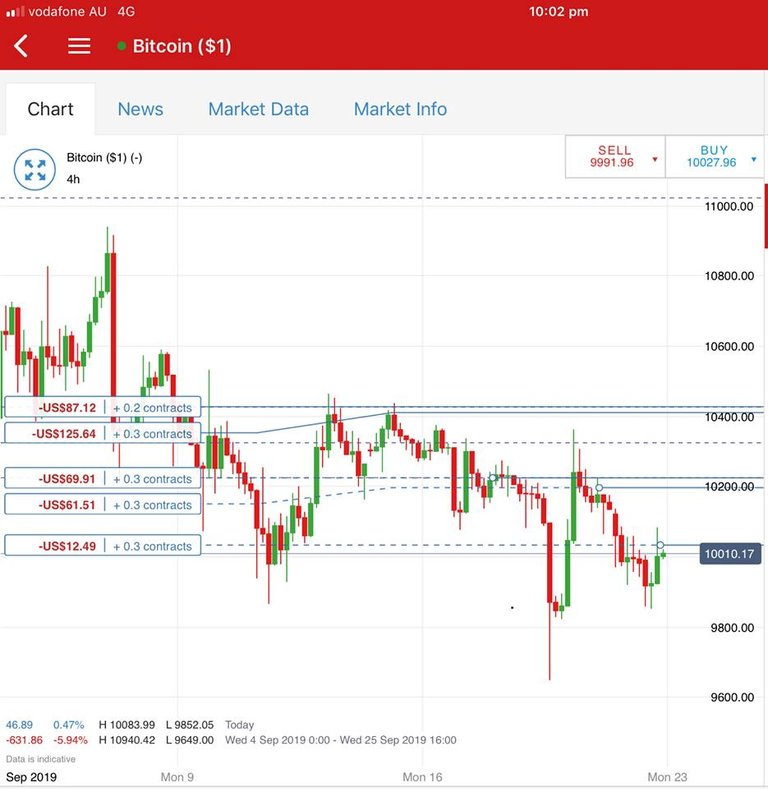
Bitcoin (BTCUSD): Price range for the weekend was $466 (4.5% of the high). Price drifted lower from the highs of the engulfing bar to trade around the support level at $9954.
Added one new trade on a 4 hour reversal to replace the winning trade from the last cycle up.
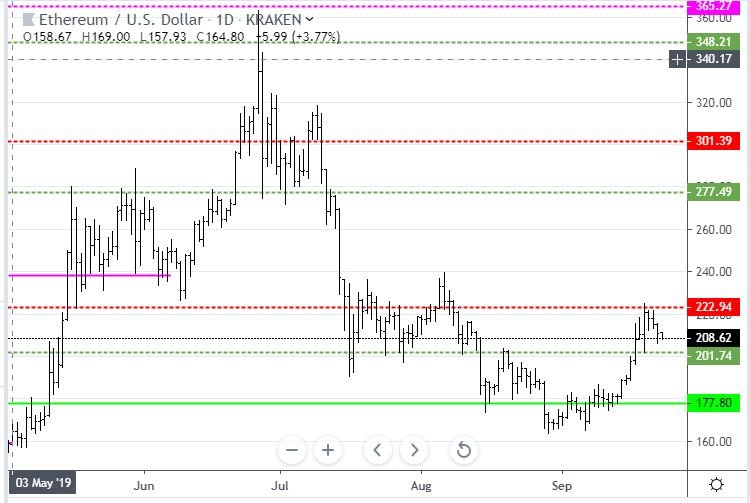
Ethereum (ETHUSD): Price range for the weekend was $15 (6.8% of the high). Price spent two days testing resistance at 222 and failed to hold there dropping into the middle between the levels.
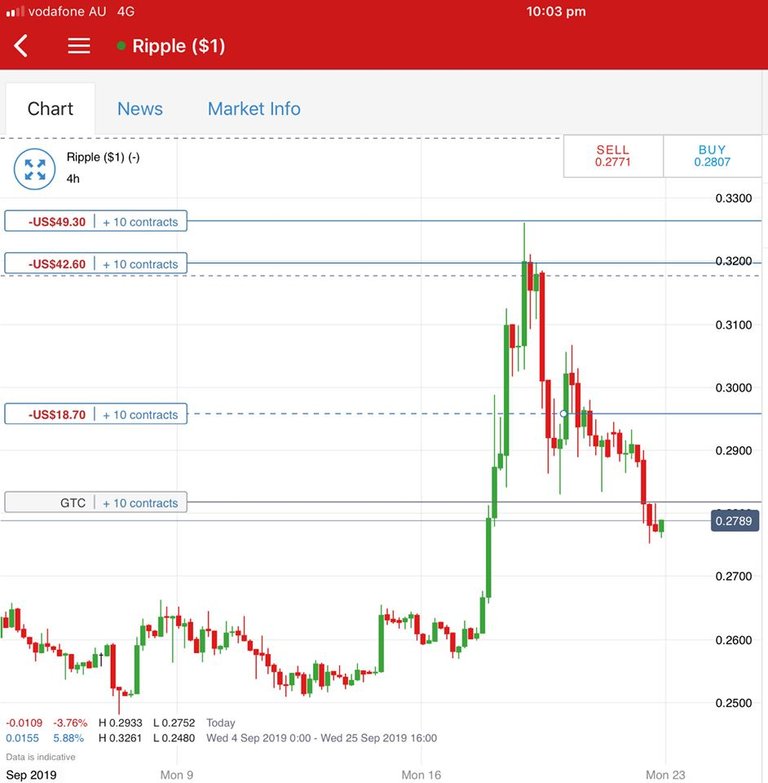
Ripple (XRPUSD): Price range for the weekend was $0.03382 (11% of the high). Price could not hold the $0.30 level and retreated to test support at $0.27735 - and it is thinking about going lower.
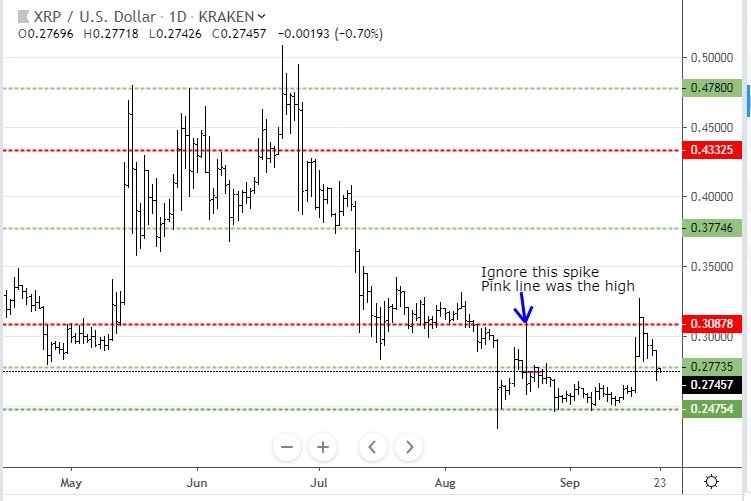
I added one new trade on a 4 hour reversal pending order which got taken in by the spread. I hate that.
CryptoBots
Profit Trailer Bot No closed trades
New Trading Bot Trading out using Crypto Prophecy. No closed trades
Currency Trades
Outsourced MAM account Actions to Wealth closed out 3 trades on EURUSD and AUDNZD for 0.22% profits for the day. Trades open on EURUSD (0.23% negative). I was right about being long EUR - one trade loses and the remaining open one is losing.
Cautions: This is not financial advice. You need to consider your own financial position and take your own advice before you follow any of my ideas
Images: I own the rights to use and edit the Buy Sell image. News headlines come from Google Search and SMH.com.au. Jim Cramer tweet comes from Twitter.com. All other images are created using my various trading and charting platforms. They are all my own work
Tickers: I monitor my portfolios using Yahoo Finance. The ticker symbols used are Yahoo Finance tickers
Charts: http://mymark.mx/TradingView - this is a free charting package. I have a Pro subscription to get access to real time forex prices
September 20, 2019

really informative and fun to read
Thanks
Hi, @carrinm!
You just got a 0.39% upvote from SteemPlus!
To get higher upvotes, earn more SteemPlus Points (SPP). On your Steemit wallet, check your SPP balance and click on "How to earn SPP?" to find out all the ways to earn.
If you're not using SteemPlus yet, please check our last posts in here to see the many ways in which SteemPlus can improve your Steem experience on Steemit and Busy.