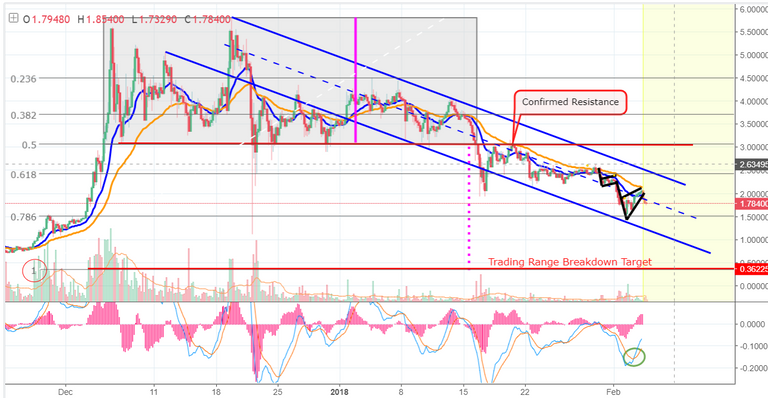
Hi friends! Welcome to this update analysis on Iota! Let's jump right in. Looking at the four hour chart, you can see that IOT 14.29% fell all the way down to the 78.6% retrace, nearly touching the bottom of the downtrend channel . The buyers were quick to jump in (as you can see by the large green volume bar) but the subsequent recovery appears to be a bearish consolidation, like many of the other coins that I cover. Volume has quickly diminished, but the MACD continues to surge higher. So we've got falling volume , a rising MACD , a bear flag consolidation, and overhead resistance. As I conduct my analysis, I know that many people will say "that's not a bear flag , it's this and it's that, and you suck at charting and blah blah blah." So I look around the room, and I say "who's teaching this class? You or me?" LOL In all seriousness, what we're doing here, is simply identifying a bearish pattern . We're looking at it. We know that it's there and we're going to continue to watch it. That's what trading is all about. Sure the bear flag could break to the upside. Then all of the TradingView goons will climb to the mountain tops with their bullhorns, to shout how wrong I am. That's not what technical analysis is. I see a pattern. I watch it, and I wait to see what it does. If the bear flag breaks to the upside, my views may change. Typically, however, bear flag patterns, that rise into resistance, on falling volume , during a bear market, in a downtrend channel , usually produce a continuation to the downside. Can you fault me for pointing that out? Peace.