Welcome to the weekly edition of the InLeo stats report.
This is a weekly report covering May 13th to May 19th, 2024.
If you want to learn a bit more about the InLeo ecosystem and dig into the numbers, this is the place to be.

The following topics will be covered:
- Issued LEO Tokens
- Top LEO Earners
- Rewards to HP delegators trough the leo.bounties program
- Daily stats on tokens staking
- Share of tokens staked
- Top Users that staked
- Unique number of users
- Posts/comments activities on the platform
- Posting from InLeo.io interface
- Price Chart
Issued LEO Tokens
Let’s take a look into token issuance and how it is distributed over time.
Below is a chart that represents the cumulative issued LEO tokens.
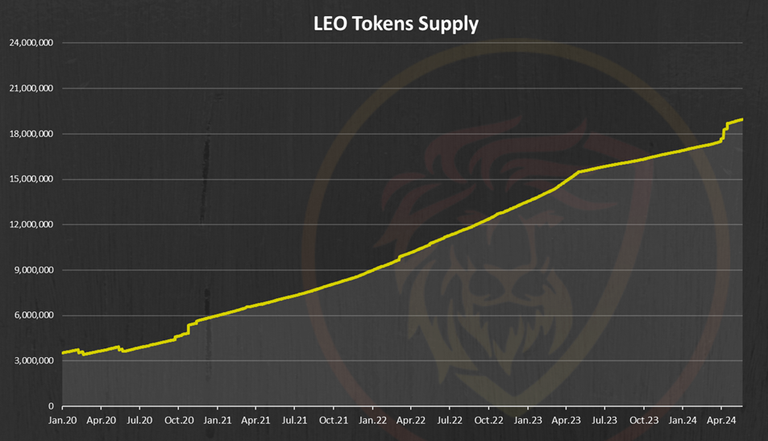
This chart is representing the total LEO supply, circulating supply and burned tokens. We can see the recent spike in the issued LEO tokens due to the ending of the CubFinance platform and reimbursement in LEO.
A total of 19.2M circulating supply.
Next is the issued LEO tokens from last week. Here is the chart:
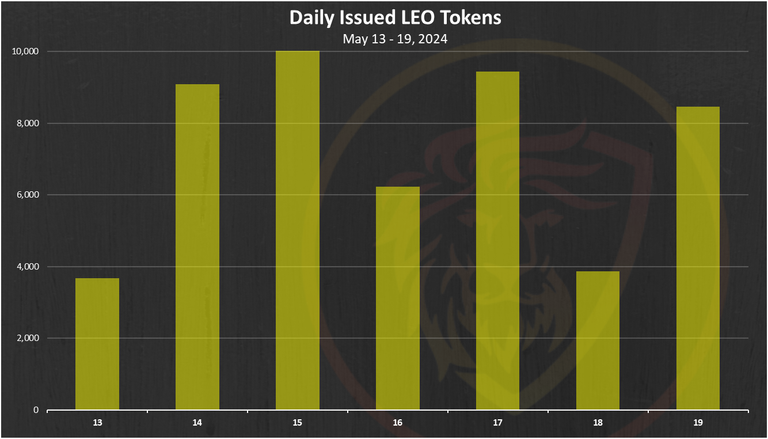
The amount of daily LEO issued is around 7k per day.
Let’s see how these tokens were distributed.
Below is the chart of the top 10 LEO earners this week.
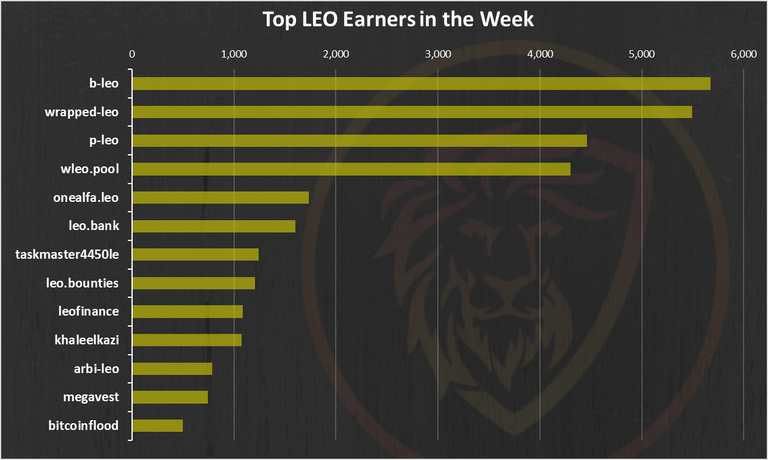
The @b-leo account is on the top, followed by the other LEO token pool accounts.
Rewards from Bounties
Users who delegate their HP to the @leo.voter receive daily payouts in the form of LEO tokens at a rate of 16% APR. Also, at this time some other bounties are in place.
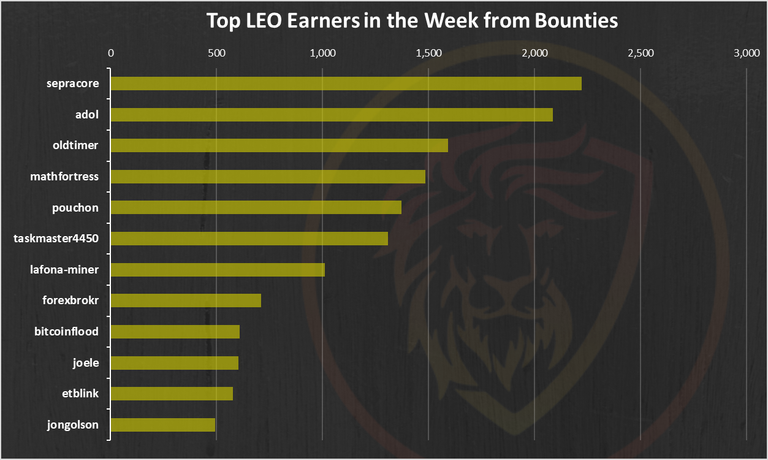
@sepracore is on the top here.
Staking LEO
Below is a chart that represents the monthly flow of staked and unstaked LEO tokens. A positive bar going up shows a day where more LEO was staked than unstaked.
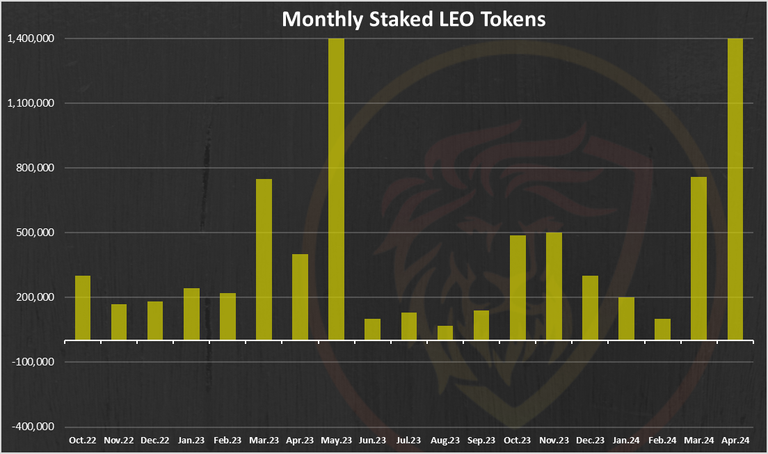
We can notice the big spike in the staked LEO due to the airdrop to the CubFinance participants.
Below is the chart of the top 10 users that staked LEO last week:
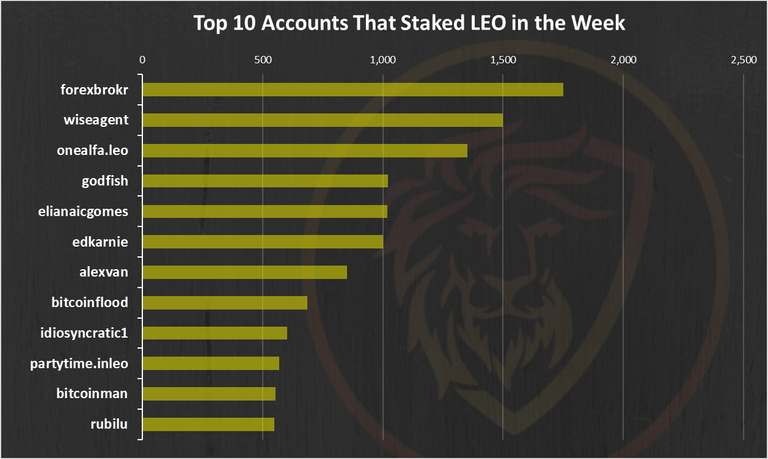
The @forexbrokr account is on the top here.
Liquid VS Staked:
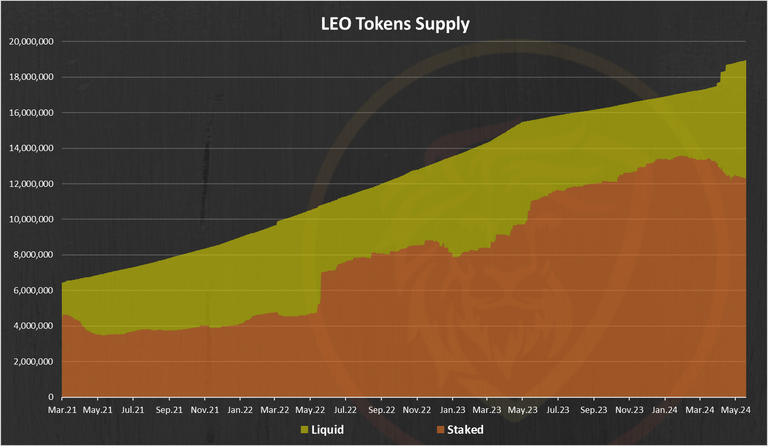
Note on the yellow, liquid category above. It includes the LEO in the liquidity pools on ETH and BSC as well. If we remove that, the liquidity will be much lower.
Below is a chart of the LEO tokens allocation.
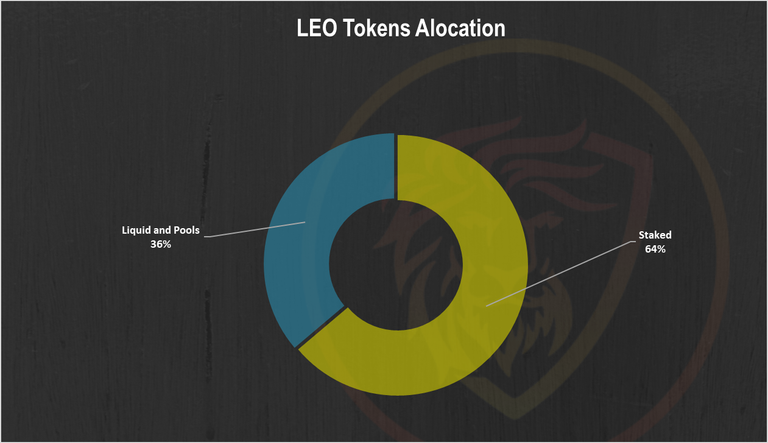
A 64% LEO staked.
InLeo Users
Below is a chart with the number of unique users that posted from the InLeo frontend.
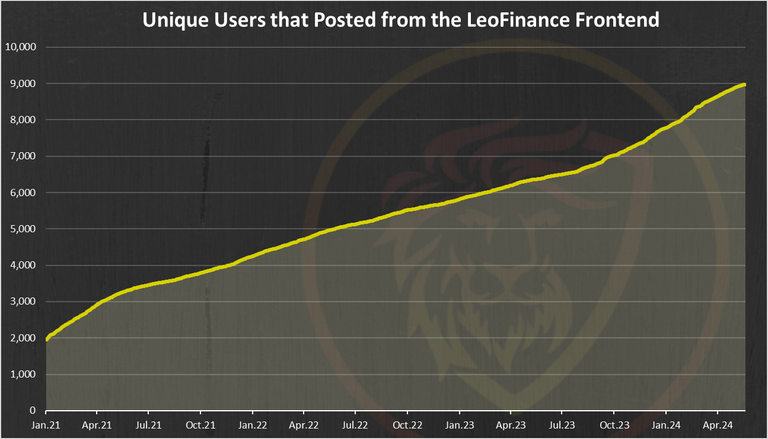
A 9k unique accounts have posted from the InLeo.
Monthly Active Users on InLeo [MAU]
Here is the chart for the monthly active users on InLeo.
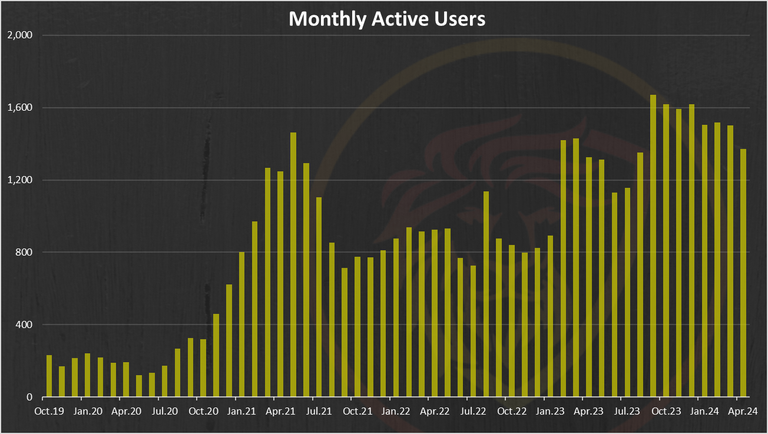
April has 1400 users.
Posts, Comments and Threads
Here is the chart.
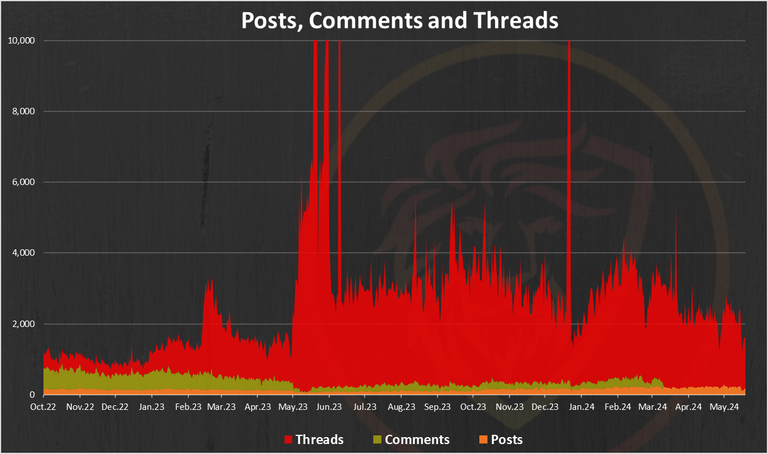
Some ups and downs here, with the numbers in the range of 2k to 3k in the last period.
Top Threads Creators
Here is the chart.
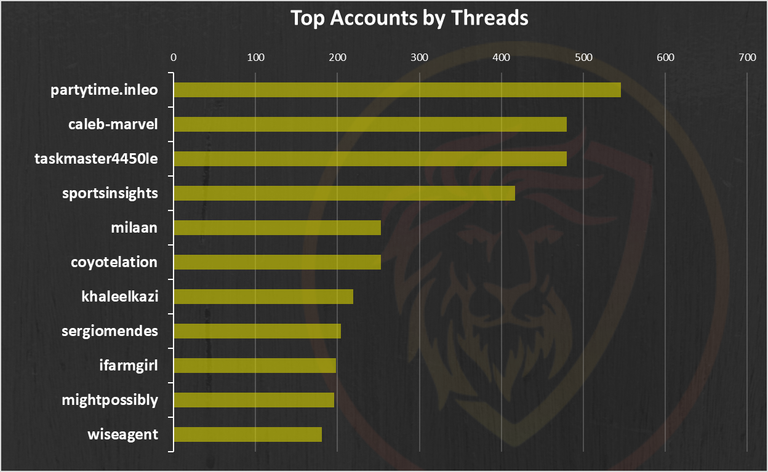
@partyime.inleo is on the top here.
Price
Here is the price chart in dollar value with average price.
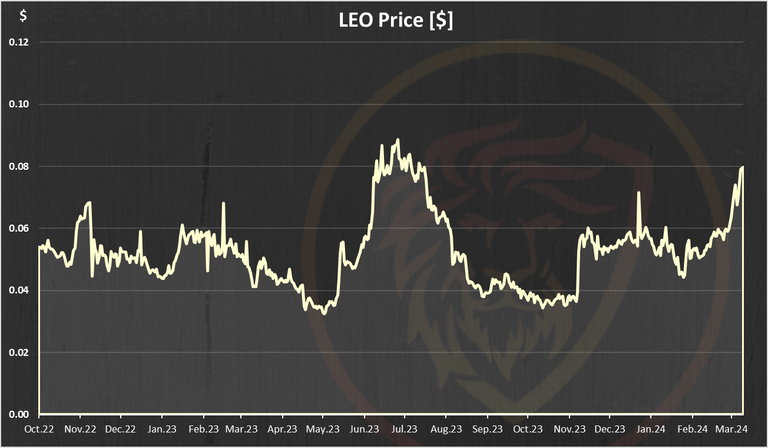
The LEO token has seen an increase in the price in the last period, especially with the annucment of the new leodex and the integration with the Maya protocol.

Report by @dalz
Posted Using InLeo Alpha
Leo staking is growing very nicely, I'm super bullish on $LEO and will keep accumulating myself.