
It has been a hot and cold week for Bitcoin and alt coins as NEO, Litecoin, Stellar Lumens, IOTA and EOS. While impressive developments continue to happen in most of these coins, our altcoins technical analysis points to lower lows in the coming days unless otherwise.
This week I shall primarily focus on EOS-it’s up 5.34% in the last 7 days and see if buyers will build on Dawn 3.0 news.
Let’s have a look at these charts:
XLM/USD (Stellar Lumens)
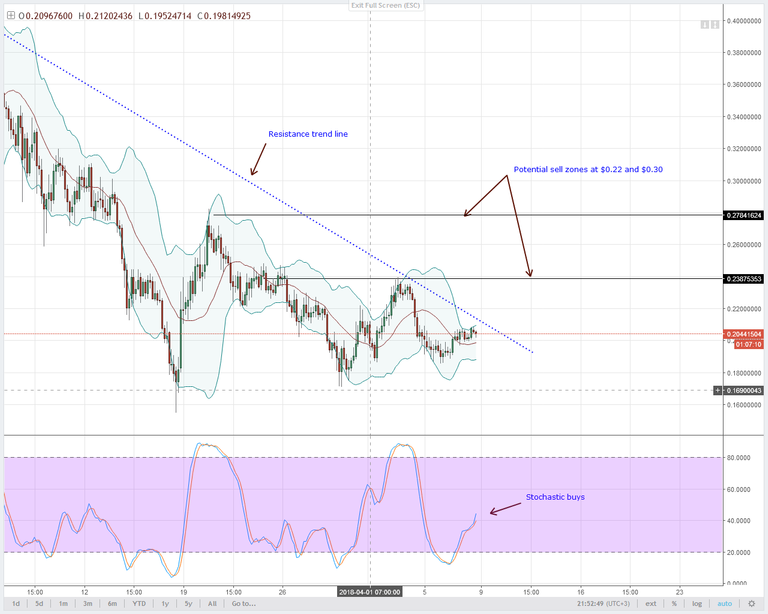
Stellar Lumens Technical AnalysisXLMUSD 4HR Chart from Bittrex for April 9, 2018
Supportive comments from IBM over the weekend and after all, they have a stake in Stellar. As we all know, IBM is a technological front runner and blockchain shillers. Consequently, their statement that most G20 central bankers have plans of digitizing their systems should be seen as positive as they may be developments that are still within the corporate circles.
Anyway, other than this, Stellar Lumens is now available at CEX.IO. What this means is that any investor who sees value in Stellar can buy instantaneously using their Visa or MasterCard credit card.
On the technical front, Stellar is recovering. Despite than 0.01% rise in the last 24HRs and a stochastic buy signal in the 4HR chart, sellers are still in the driving seat.
I shall still retain this skew until I see a jut past $0.22-a strong level of resistance marked by the 78.6% Fibonacci retracement line and the middle BB clear in the daily chart. Going forward, every high will remain a selling opportunity.
IOT/USD (IOTA)
IOTA Technical AnalysisIOTUSD 4HR Chart from BitFinex for April 9, 2018
Undoubtedly, the cryptocurrency selling frenzy continues to wreck havoc on cryptocurrency valuation. As visible from the chart, sellers saw fodder in IOTA and continue to feed on it now that prices are trading at parity with the USD. There are even more risks for a downside considering our IOTA technical analysis despite MS promising to inject $5B in the next 4 years.
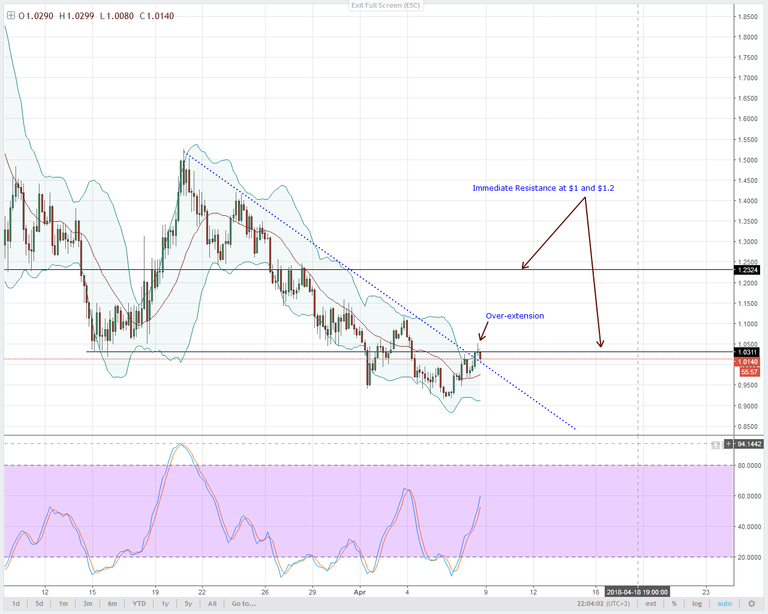
Our weekly chart hints of strong bears as that long upper wick shows and in the 4HR chart, prices are trending right at the resistance trend line complete with a candlestick closing above the upper BB. That’s an over-extension at $1, a resistance level and what it does mean is sellers are baying for blood. I will only recommend sells if there is a close below $0.95 before then let’s wait for a stochastic sell signal to print before giving sellers a go. Ideal targets are set at $0.35.
EOS/USD (EOS)
EOS Technical AnalysisEOSUSD 4HR Chart from BitFinex for April 9, 2018
We can as well go on and talk about EOSIO Dawn 3.0 and how the EOS is well on course. Awesome stuff really but with EOS mainnet launching in less than 2 months, should we expect prices to explode? Of course EOS has a vibrant community with a serious war chest. If their plans of a giving Tron and Ethereum a run for their money once they break off from the ERC-20 token category, then investors should be expectant for a positive ROI.
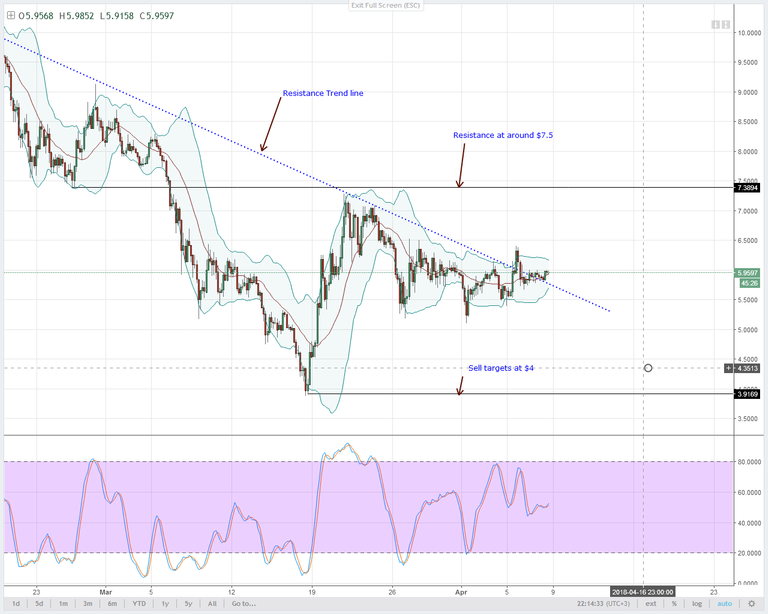
Before then, our EOS technical analysis hints of the effect of week ending March 18 candlestick. Technically, prices are bearish and judging with developments in the weekly chart, EOS is definitely trading within a bear break out.
As a result, what this means is that sellers can find shorting opportunities in the 4HR chart as long as they oscillate below $7.5. I will recommend patience for now and only trade when prices test $7.5 or when a stochastic sell signal prints and there is a bearish candlestick confirming such. Overly, our ultimate sell target is $4.
LTC/USD (Litecoin)
Litecoin Technical AnalysisLTCUSD 4HR Chart from CoinBase for April 9, 2018
Whether Roger Ver Bitcoin Cash is a Bitcoin poser or not, chances of Litecoin busting to the top 4 remains likely. Of course, other cryptocurrencies like Ripple have had their own fair share of criticism but Litecoin continues to be quite resilient. Anyhow, we can’t wish away the over confidence of Charlie Lee and LitePay mess but as it is, Abra was timely.
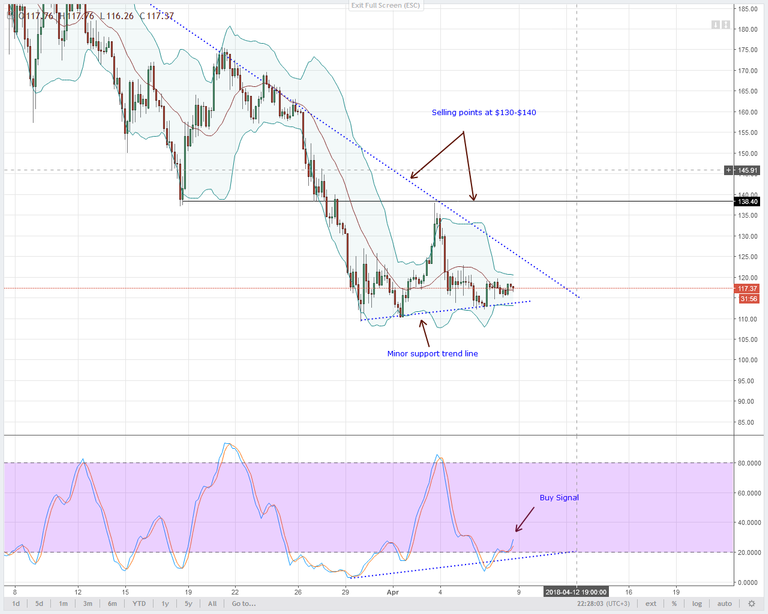
In our 4HR chart, bears are fattening up and we don’t know when winter will be. From Litecoin technical analysis, that might be when prices test $90 or even $50. Because of this, I’m only looking for shorts in the 4HR chart.
Currently, there is a buy signal in place and I expect two things to happen. Either there is temporary appreciation towards $140 or a collapse and close below $110. It’s likely that prices shall rise meaning we have to wait until a stochastic sell signal prints. If not, any close below $110 means sellers should sell with targets at $90.
NEO/USD (NEO)
NEO Technical AnalysisNEOUSD 4HR Chart from Bittrex for April 9, 2018
If NEO will be king or not, that’s still a subject of discussion-and of course, performance but as far as price action is concerned, it’s still a long way to go.
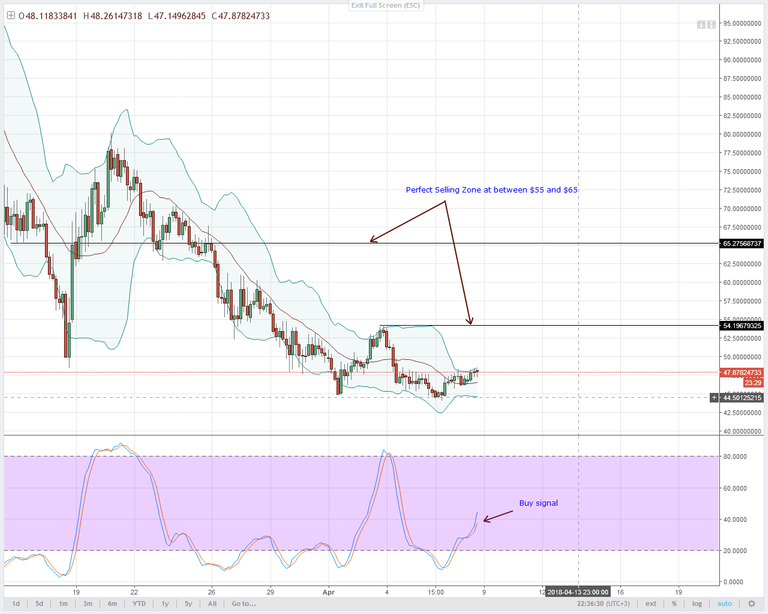
In my NEO technical analysis preview, I expect resistance at $55 and on the upper end $65. As such, I recommend short term buys with stops at $45 until a stochastic sell signal prints in the 4HR chart.
All charts courtesy of Trading View
Tags: altcoin price analysis, altcoin technical analysis, Buy Stellar Lumens at CEX.IO, EOS Dawn 3.0 Launch, eos technical analysis, IOTA Microsoft $5B deal, iota technical analysis, Litecoin Abra Partnership, litecoin technical analysis, neo technical analysis, Stellar Lumens Listed at CEX.io, stellar lumens technical analysis
Hi! I am a robot. I just upvoted you! I found similar content that readers might be interested in:
https://www.newsbtc.com/2018/04/08/neo-eos-litecoin-iota-stellar-analysis/
Congratulations @ranawali! You have completed some achievement on Steemit and have been rewarded with new badge(s) :
Click on any badge to view your own Board of Honor on SteemitBoard.
To support your work, I also upvoted your post!
For more information about SteemitBoard, click here
If you no longer want to receive notifications, reply to this comment with the word
STOPDo not miss the last announcement from @steemitboard!