Hi everyone, today's post is about "How to sketch the graph of a given linear equation in two variables?" It is good to know that the primary importance of a rectangular coordinate system is that it allows us to visualize relationship between two variables through a graph. And a good foundation in this topic allows us to appreciate the ideas of René Descartes which are now used in practically every scientific and business-related field.
Before we do our task, make sure we already know how to plot points in the coordinate plane and have a clear understanding on the following key terms.
The relationship between the variables " x " and " y " is often given by an equation. From such equation, a table of values is constructed by choosing some x-values and calculating the corresponding y-values.
The variable " x " is called the independent variable since we are free to choose arbitrary values of " x ". The variable " y " is called the dependent variable because its values depend on the chosen values of " x ".
The ordered pair (x,y) obtained from the equation is called solution of the equation in which it implies that when the ordered pair is substituted in the equation, the resulting statement is true. It constitutes the ordered pair ( x,y ) which can be plotted as a point in the coordinate plane.
Note to ponder:
• When sets of ordered pairs are plotted in the coordinate plane, the resulting points make up the graph of the linear equation which is a straight line.
• In sketching the graph of an equation remember that the graph drawn is just an estimate of the true graph because only a finite number of points are considered.
Let us consider the graph of the equation 2x + 3y - 6 = 0
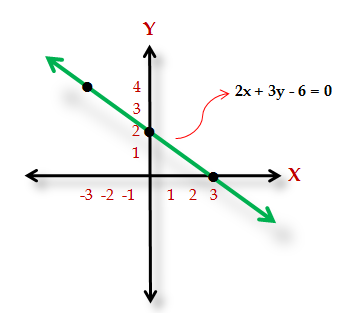
Note: The graph of the equation 2x + 3y - 6 = 0 is represented by the straight line.
How to sketch this graph?
Steps:
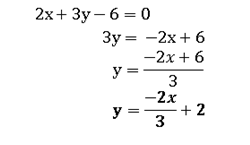
- Rewrite the equation by solving " y " in terms of " x " whenever possible.
- Assign some values of " x " and solve for y. Write these values in a table.
- Plot the points given in the table in the coordinate plane.
- Connect the points with a straight line.
Application of those steps:
Task:
Sketch the graph of the equation 2x + 3y - 6 = 0
Solution:
● Rewrite the equation by solving " y " in terms of " x "
Reveal spoiler
● Assign some values of " x " and solve for " y ". Write these values in a table.
Reveal spoiler
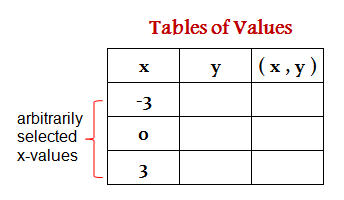
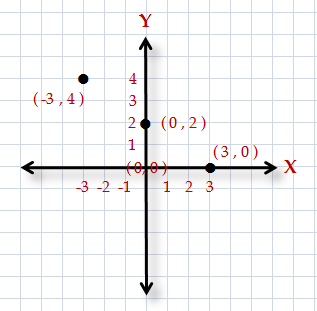
Although the choice of x-values in forming a table of values is arbitrary, we usually include x = 0 and y = 0 because they result in relatively easy computations and they give the points at which the line crosses or or intercepts the axes.
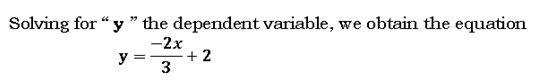
Solving for " y "
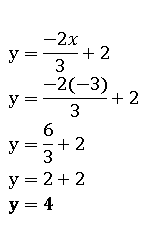
Set x = -3 and solve for y
Reveal spoiler
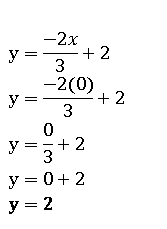
Set x = 0 and solve for y
Reveal spoiler
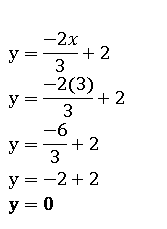
Set x = 3 and solve for y
Reveal spoiler
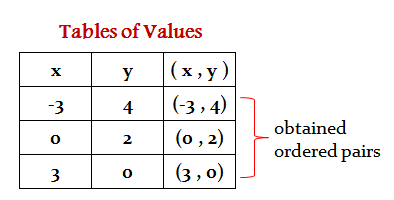
write the obtained ordered pairs in the table of values
● Plot the points given in the table in the coordinate plane.
Reveal spoiler
● Connect the points with a straight line.
Reveal spoiler
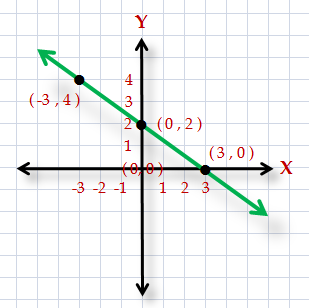
Task completed!
So, how did you find the task? Now that you know how easy it is to sketch a graph, be might as well excited to learn another task.
Have a nice day!
References:
- https://en.wikipedia.org/wiki/Linear_equation#Two_variables
- https://www.wikihow.com/Make-a-Line-Graph
- Textbook in Mastering Intermediate Algebra 2
This post has received a 3.97% upvote from @aksdwi thanks to: @fabio2614.