Stellar Lumens [XLM] is riding high with a 30% growth in its price as it surged behind other altcoins. Now, the coin is seeing a loss, although as a correction or impending bear run is not clear. ![]
30 minute:(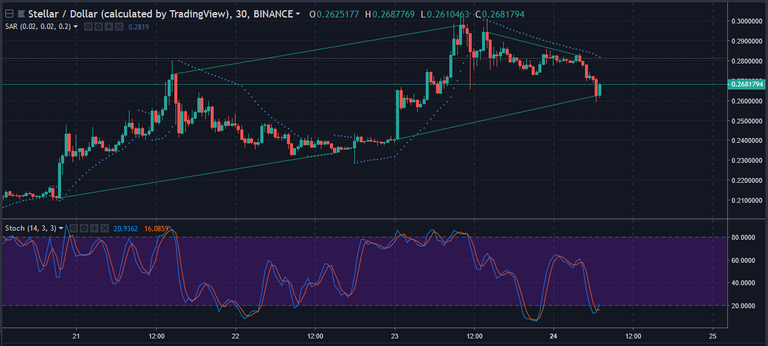 )
)
Stellar Lumens [XLM] is riding high with a 30% growth in its price as it surged behind other altcoins. Now, the coin is seeing a loss, although as a correction or impending bear run is not clear.
The $0.240 – $0.262 uptrend is a continuation of the $0.211 – $0.233 uptrend, exhibiting strong buying power. The $0.294 – $0.282 downtrend should be focused on, as a break in this will see the coin reaching higher.
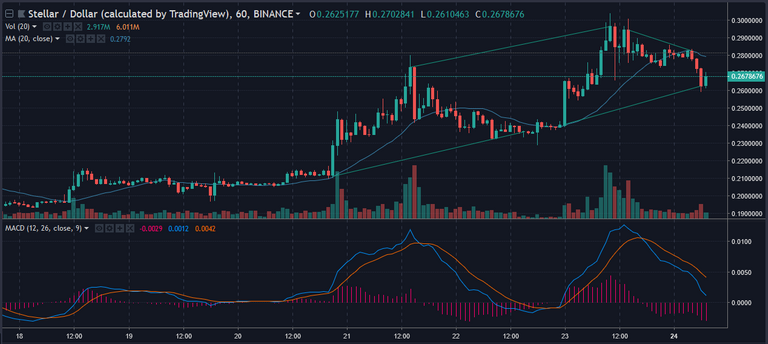
1 hour:
The parabolic SAR is flashing a bearish signal, as evidenced by the dots above the candles. However, looking at it in conjunction with the Stochastic provides a buy signal, as it is recovering from being oversold.
The MACD is diverging, and the histogram is below zero. The indicator is exhibiting a bearish crossover signal, as seen by the MA line crossing below the signal line.
The 20-period MA is at $0.243, providing a support level for a future drop.
A triangle is forming between the trend lines at $0.211 – $0.233 and $0.294 – $0.282, which is indicative of a breakout.
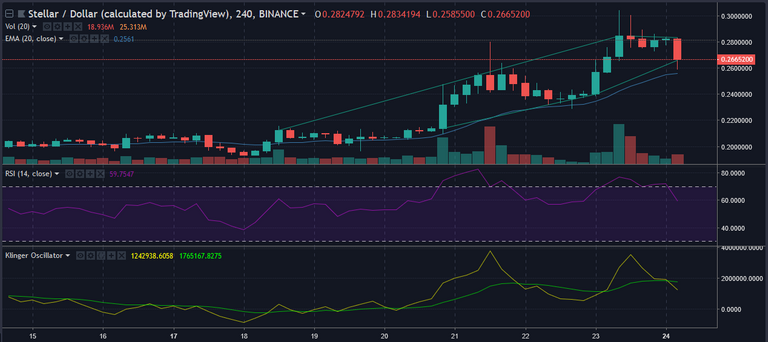
The 20-period EMA is at $0.256, again acting as a support level for the next rally. A channel is forming between $0.212 – $0.240 and $0.209 – $0.240, setting the scene for a breakout to occur soon.
The RSI dipped back down from oversold owing to the recent bull run.
The Klinger Volume Oscillator is flashing a bearish sign, as seen by the line crossing the oscillator when it is on a downtrend.
$0.333 – $0.281 provide a strong long-term downtrend line that the coin has to break in order for a reversal. This trend couples with the $0.197 – $0.189 line to form a channel indicative of a breakout.
4 hour:
Breaking above the $0.333 level will indicate that the bulls have taken control and reversed the trend.
1 day:
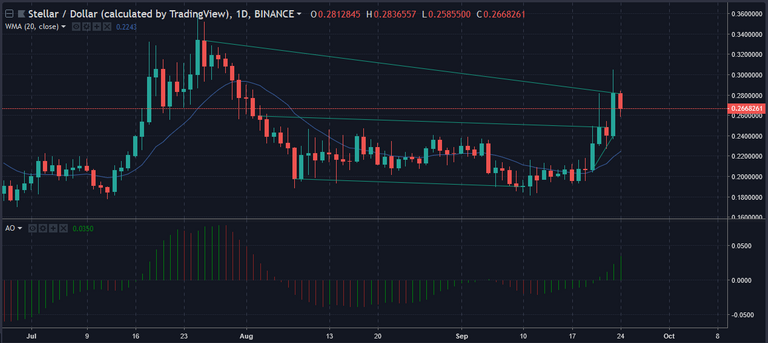
The 20-day Weighted Moving Average is $0.224 providing a support in case the price drops below $0.260.
The Awesome Oscillator is flashing an Above Zero Line bull indicator, hinting that the price might move upwards.
Conclusion:
The bears and bulls are fighting for control over the price, with market movement having lost momentum for the time being. A bullish break will occur above the $0.333 mark, as it would mark the break of a long-term downtrend. In case of a bearish run, support will be found at the $0.24, $0.22 and $0.19 levels.