Sell programs swamped the stock market from the moment the stock market opened on Thursday and persisted throughout the day, with the Dow 30 plunging 204 points, the Nasdaq Composite down 135 points, and the Russell 2000 off 24 points.
Friday's trading saw only a little upward movement, keeping the indexes near lows for the week.
The North Korean war rhetoric is like throwing a match on dry grass — it’s very combustible given the very parched conditions that exist independently of North Korea.
We learned Thursday that the U.S. ran a nearly $43 billion budget deficit in July, which also poured gasoline on the situation! Also, U.S. Producer Prices (PPI) fell -0.1% when stupid analysts were expecting an increase of 0.2%.
In addition, OPEC announced crude oil production rose further in July, in the latest sign that OPEC’s efforts to reduce output was all talk as the oil glut spikes once again.
o, investors were in no mood to hear any sort of negative news going into the seasonally weak period of August through September, especially as tensions with North Korea seem to be intensifying.
The Nasdaq Composite fell 2.13%. Remember, after July these stocks were pushing a standard deviation of three times above their mean averages, so when they broke their 50-day moving averages, volatility exploded.
If you'll recall, we talked several times about expecting the VIX to bottom in July and then turn up after July and through October, according to seasonal cycles we have seen over and over.
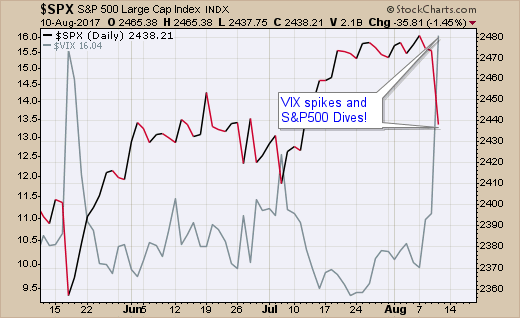
As I pointed out on Wednesday to my Stealth Stocks Daily Alert readers, the Russell 2000 index leads on the way down and has largely given up its gains for the year, today testing its 200-day moving average, having peaked in mid-July. Volatility is picking up with the VIX jumping to 16.04 from its low of 8.84 on July 26th!

Once the 50-day moving averages are violated, it triggers a lot of sell stops, just below key support levels, and this magnifies the selling, especially considering that much of the market gains are on record margin levels. It’s like a rubber band extended to the point of breaking and then let go — it finally is going to revert back to the mean.
My guess is the investment banks will let the Russell 2000 break the 200-day moving average support to collect shorts and then squeeze them again. Then they will slam the “buy the dippers” at the 50-day moving average and back down again it goes. Look for a spike in volatility for a while.
A Crazy Bond Market
In other news, I want to show you another interesting chart. This illustrates how crazy the global bond market has become because of QE under the ECB.
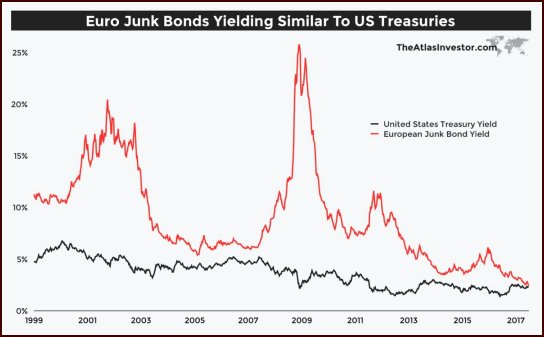
When Italian junk bonds are yielding the same yield as U.S. Treasury yields, it either illustrates the risk the ECB is trying to cover over or the world markets equate U.S. Treasury bonds with the same risk as Italian junk bonds!
I am going to let you decide which has a higher-quality rating.
Gross Value Added Predicts Recessions
I have been telling you that three rate hikes have a history of producing bear markets in the past and could do so again because when short-term and long-term interest rates are less than 1% there just isn’t enough profit for commercial banks to lend money. Recessions develop out of these situations.
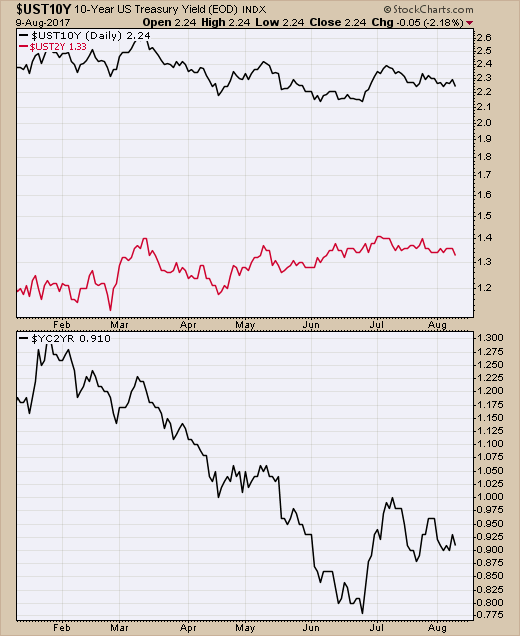
The difference between a two-year Treasury bond and a 10-year Treasury bond remains less than 1%, as this chart illustrates.
The “Gross Value Added” (GVA) measures economic activity from the production side of the economy, taking the dollar value of all goods and services produced less the costs of producing these goods and services.
The “Gross Domestic Product” (GDP) measures the economic activity using the level of commerce based on the dollar value of the final goods and services produced.
Economists like to strip out inflation (CPI) to measure the pure value added, so inflation is subtracted in both methods to determine the real GVA or RVA, or real GDP.
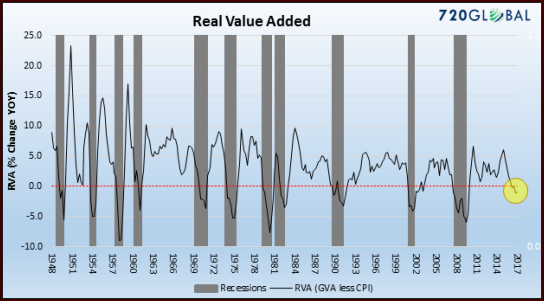
If we look at the GVA measure of the economy, the GVA has only been negative during recessionary periods since 1948. Periods deemed recessionary are in gray, according to the National Bureau of Economic Research.
This is why the next three months are so dangerous... from many different perspectives.
Source: outsiderclub
Be Sociable, Share! Resteem! and Upvote!
Posts you may like
 7 THINGS TO ASK WHEN BAD THINGS HAPPEN
 This is one company that might ride on the remarkable growth of AirAsia
 Simple Warren Buffett's investing strategy which anyone and everyone can use.
 Stay away from the UK
 The collapse of US economy??