Refreshing your memory
In the first lesson of learning a TA i discussed a couple of things. Most of the things we discussed were the basics of a TA like which charts you can look at. If you missed that go check that out first ( Lesson 1). Today i am gonna talk about different forms of a TA and some unkown patterns (Techniques).
Index
- Elliot wave analysis
- Fibonacci levels
- Bullish engulfing pattern
- Bearisch engulfing pattern
- The false breakout
Elliot wave analysis
The Elliot wave analysis is a form of technical analysis that cryptocurrency traders use to analyze market cycles and forecast market trends by identifying extremes in investor psychology, highs and low in prices and other factors.
Elliot wave principal is based on the believe that markets are affected by collective investor psychology. This way the patterns are predicatble and repeat themself. This strategy is suited for cryptocurrency, because the markets of crypto are only driven by collective investor psychology.
So the actual technique is based on unique characteristics in the wave patterns. So basically you will have "trend" waves and "corrections". The trend waves go up and the corrections go down simple. Lets look at the chart below.

You can see here 5 waves are drawn out. This is the elliot wave pattern made simple. You would say if you can recognize the waves you master it. But Elliot waves takes years to master it even i can't do it yet. This mostly is because you can have a pattern within a pattern within another pattern. So you can sometimes find the 5 waves within a wave of a bigger elliot wave pattern.
Conclusion
Elliot waves can be very usefull within trading if used correctly. But remember even the best traders in the world find Elliot waves challenging. So should you really use this in your trading? Make your own conclusion and if you are interested in it below is more information.
Fibonacci levels
Simple explanation of this is Fibonacci levels helps you find possible support and resistance levels. Fibonacci retracment levels use horizontal lines to indicate areas of support or resistance at the key Fibonacci levels before the trend continues in the original direction. These levels are created by drawing a trendline between the high and low and then dividing the vertical distance by the key Fibonacci ratios of 23.6%, 38.2%, 50%, 61.8% and 100%.
These might sound difficult so let me show you a chart to simplify things.

Source
So its not that hard just basic math. Lets say that the chart one day was up to 0.28 BTC then that is 100% of the chart. So i you wanna know the 50% line you just divide it and u get 0.14 BTC on the 50% line. Can't make it any easier.
Conclusion
Obiviously there are some exceptions so if you want to use this i suggest studying it. But the fibonacci levels are much easier to use then the Elliot waves. So personally i really like the fibonacci levels for crypto and i also use it myself. I do want to point out that every trader is different so use whats comfortabel for you.
Bullish engulfing pattern
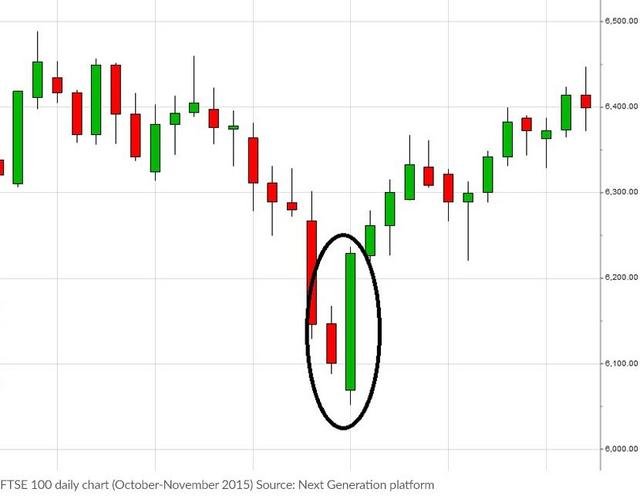
This pattern is simple to spot. When something is on a downtrend just like with crypto right now. You can spot a trend reverse. When the green day overshadows the previous red day completely. This means there is a big change that the downtrend will reverse to an uptrend.
Bearisch engulfing pattern
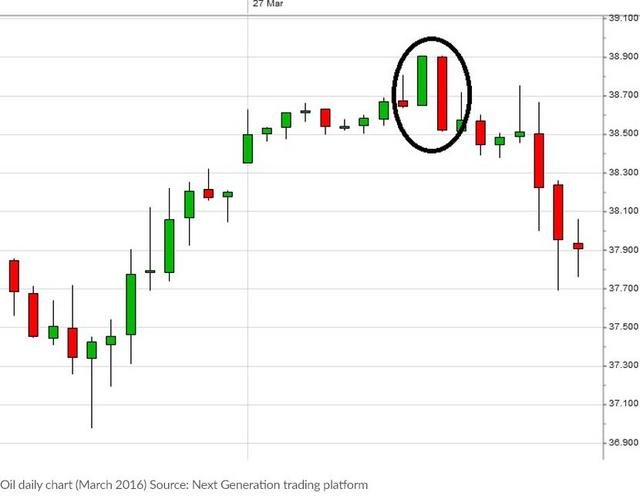
The bearisch engulfing pattern is about the same as the bearisch one. You are just looking for the exact opposite as the last one. Here you are looking for an uptrend that is been going for a while. Now you just like in the picture above you look for the bearisch day that is bigger then the previous upday.
False breakout
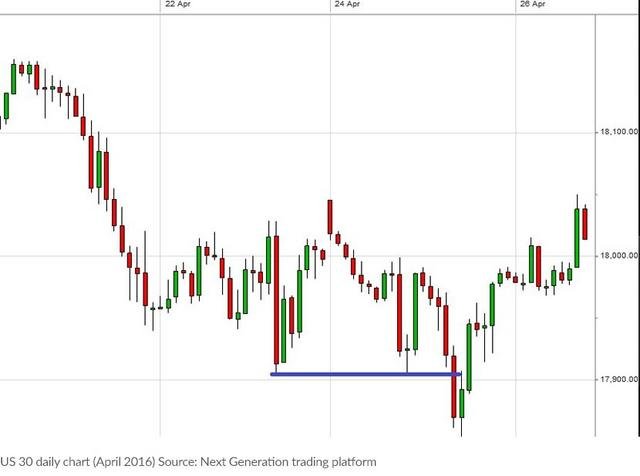
The false breakout is a common pattern. This is uknown because every trader is always looking for the breakout the place his trades. You can see here that it was trading around the support level for a couple of trades. Then there was a breakdown but the market quickly jumped back up. In this case all the people with a tight stopp-loss got flushed out of the market.
Summary
As a trader, it’s important to remember that no one form of analysis can be 100% accurate all of the time. It’s therefore invaluable to use a combination of trading strategies and technical indicators to identify potential entry and exit points, so you can put together a robust trading strategy.
Alot of information i got is from investopdia. So i highly recommend u check that site out if your interested in this.
Disclaimer: Most these pictures aren't from me
Author: #Bartcardi
A follow, comment, upvote and resteem rare highly appreciated!
My account is still pretty small so i can use all the support i can get!

DISCLAIMER: dropahead Curation Team does not necessarily share opinions expressed in this article, but find author's effort and/or contribution deserves better reward and visibility.
to maximize your curation rewards!
with SteemConnect
12.5SP, 25SP, 50SP, 100SP, 250SP, 500SP, 1000SP
Do the above and we'll have more STEEM POWER to give YOU bigger rewards next time!
News from dropahead: How to give back to the dropahead Project in 15 seconds or less
This is really good stuff!! I enjoy reading over it and usually resteem for my followers. Another good idea might be to discuss the differences between different types of oscillators. For example RSI versus StochRSI. Also when to use them and how to use multiple indicators to confirm a buy or sell position.
Thats a really good idea! will implent that in the upcoming TA lessons!
Good knowledge
Its nice article and elaborated well. Its written good and interesting elaborated graphically. Good effort for the steemians. Thanks for sharing. Followed.
Resteemed by @resteembot! Good Luck!
Curious?
The @resteembot's introduction post
Get more from @resteembot with the #resteembotsentme initiative
Check out the great posts I already resteemed.
Great introduction into TA. TA can only take you so far in the crypto world and I think it's a bit of a self-fulfilling prophecy. People believe it works so it works. I think the fundamentals of a project are what really show the potential for gains but then again I'm a long-term investor.
Thank you for sharing bro so please chak my post
good up the steem 😍😍
Great information.
I had been hearing about a few scenarios regarding a second dip being a sign of upward movement in the market.
I've been playing around with the time intervals and snapshots to get a better visual.
I will be paying more closely to this starting today.
Thanks Again !!
This post was upvoted and resteemed by @resteemr!
Thank you for using @resteemr.
@resteemr is a low price resteem service.
Check what @resteemr can do for you. Introduction of resteemr.
This Fibonacci level explains itself very well. Analysing cryptocurrency is vital if you want to create a strong source from it.
Great content @bartcardi...
@iamjimmy
Thanks appreciated jimmy
You are very good leader continues. vote for me, I am new. follow me @saizor
Resteemed to over 10800 followers and 100% upvoted. Thank you for using my service!
Send 0.200 Steem or 0.200 Steem Dollar and the URL in the memo to use the bot.
Read here how the bot from Berlin works.
We are happy to be part of the APPICS bounty program. APPICS is a new social community based on Steem. The presale was sold in 26 minutes. The ICO will start soon. You can get a account over our invite link: https://ico.appics.com/login?referral=1fRdrJIW
@resteem.bot
good analysis keep going