The end of a bullrun
Today will be a continuation of the bitshares analysis, please see the stock chart below
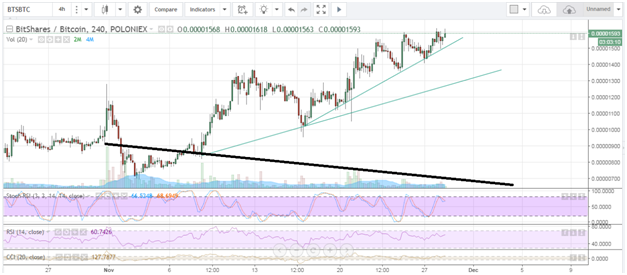
In the 4 hourly BTS/BTC chart, in the volume bars chart, a clear decreasing pattern on the volume can be identified. A decreasing volume trend does not support an increasing price trend. This is a sign of reversal and lends strength to a possible pullback.
Confirming the observation using the RSI
The RSI is currently around 63 and even though this is not oversold it is very high. This supports the view of a pullback in price and likely end to this bull run in the short term.
The prediction
It is very possible for the current trend to be broken and pullback to the bottom green line as in the image. Risk-seeking traders can go short with a target of around 0.000013, while risk-averse traders can wait for the drop to 13 to go long
Till next time,
Tinus
** Images courtesy of tradingview.com
Wrong, too many factors going on to consider besides technical, I say the bull will continue for a while still.
The post stated in the short run the current bull trend will end, it states nothing about the long run, with which I agree. It will follow an Elliot wave motion. If you disagree could you please add evidence to support your opinion?
EDIT:
You could always systematically load up on bitshares now and more if it drops if you don't want to take the risk of it not dropping