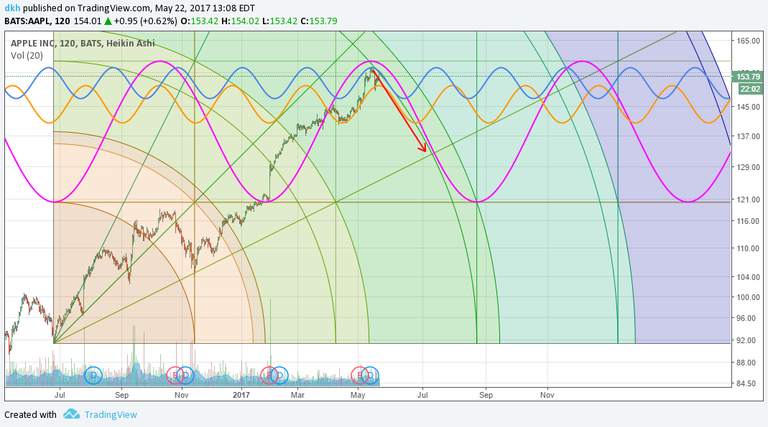
On a 2-hr chart overlaying a Gann square and algo tracker it is likely we see at least a good size pull-back from recent highs over the next 2-weeks starting between the 23rd and the 24th which would tie-in with timing on the previously posted chart on the SPX500. We know that this stock is a favorite amongst even Central Banks so we can assume that any pull-back of size will result in massive quantities of cash being infused to pump it back up. That being said we also know that scheme works until it doesn't, so be cautious and diligent, if anything bad is going to happen it will happen at the opening of the London exchange on the futures market
AAPL huh? Thanks for the Heads Up! I'll be taking a look at that. UPVOTED
Took a position 4 days out 155 Strike I like the ST bearish trade. based off fibs the retracement of swing high to swing low hit 78% so it should come back down now for a little bit. looking for retest of 150ish.
To think I bought it at $14 a share back in 2002 - but sold it too soon!