
SUMMARY
Note: For anyone who missed the BitcoinLive Information Webinar, here is the replay link: https://www.youtube.com/watch?v=32l40SNYOp4
As of June 4th, ALL Crypto Analysis will be posted on the BitcoinLive channel and Steemit will be dedicated for Equity, Commodity and Options Analysis. To Signup for the BitcoinLive limited Founding Membership slots, use this link: https://get.bitcoin.live/haejin/
__
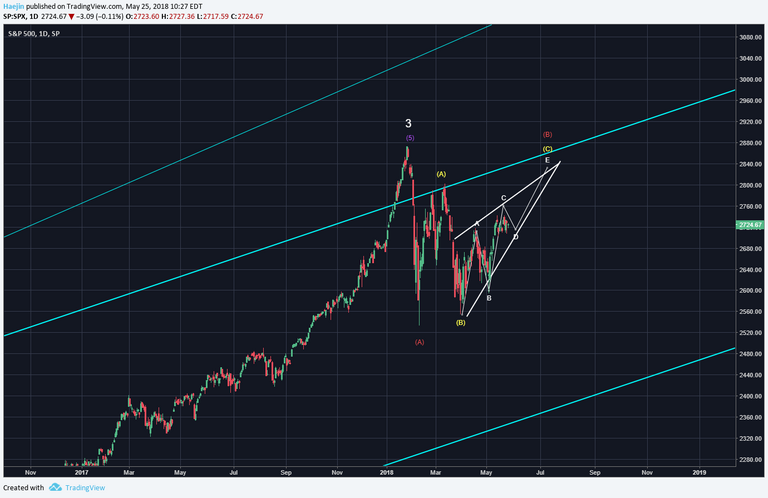
After completing white wave 3, the S&P 500 Index (SPX) came right back into the channel; thereby, creating a bull wick event. The below chart shows the subwave labeling of an ABC corrective pathway. It's likely that red B wave is morphing into an upward pointing wedge of which a,b,c, and d waves seem complete. The final e wave should complete the B wave sequence. However, recall that there can be a d wave breakdown.
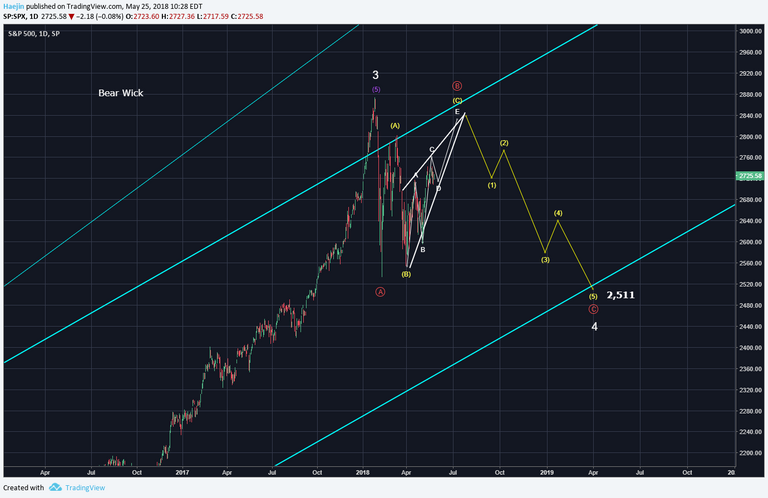
The remaining red C wave down needs to be a five wave sequence. As shown, the yellow impulse down can potentially target the 2,511 level which would complete the red C and white 4 waves. However, corrections are most difficult to project as there are 34 different pathways. My objective is NOT to project accurate corrections but identify the closest timing for their terminal ends. Why? Because for me, terminal ends of corrections are the best time to buy.
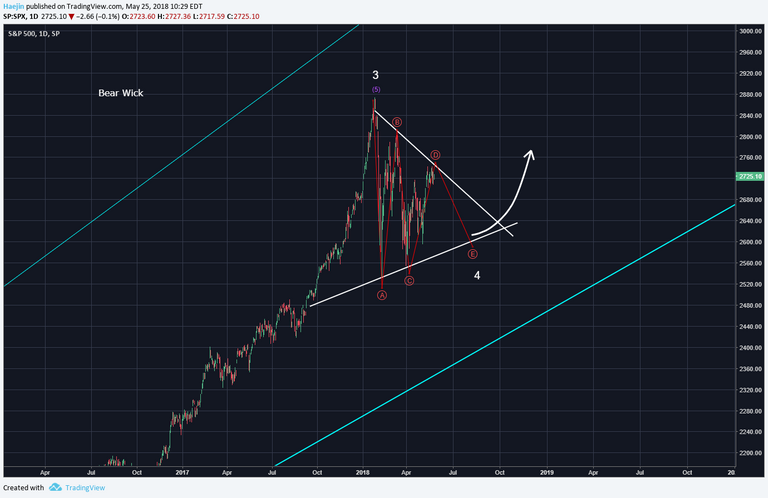
An alternate to be aware of is that a symmetrical triangle of an abcde sequence can also be morphed. IF this is the case, then it's likely that the bottom blue trendline of the channel won't be tagged. However, for white wave 4 to end in this way would be a bit too short and not enought of a decline to deplete the would be sellers.
Legal Disclaimer: I am not a financial advisor nor is any content in this article presented as financial advice. The information provided in this blog post and any other posts that I make and any accompanying material is for informational purposes only. It should not be considered financial or investment advice of any kind. One should consult with a financial or investment professional to determine what may be best for your individual needs. Plain English: This is only my opinion, make of it what you wish. What does this mean? It means it's not advice nor recommendation to either buy or sell anything! It's only meant for use as informative or entertainment purposes.
Please consider reviewing these Tutorials on:
Elliott Wave Counting Tutorial #1
Elliott Wave Counting Tutorial #2
Elliott Wave Counting Tutorial #3
Laddering and Buy/Sell Setups.
Laddering Example with EOS
Tutorial on the use of Fibonacci & Elliott Waves
@haejin's Trading Nuggets
Essay: Is Technical Analysis a Quantum Event?
Follow me on Twitter for Real Time Alerts!!
Follow me on StockTwits for UpDates!!
--
--


Thank you @haejin for the tutorial
I think it is very smilar btc/usd chart.So Btc/usd chart can use for roadmap.
Thanks @haejin for post this informative post. Keep it up
Congratulation ! @haejin you have a nice introduce post on steemit. Award is waiting for the post. Steemit is a platform of creative content creators. We hope you will be one of the best content blogger on steemit.
Thank you.
lol, If this guy is a bot, I think his program is a little off, if it's not a bot I think he missed something. @haejin has enough jucie within the steem community to make things happen. Then add in @ranchorelaxo and it's interesting how it all works together. Of course I'm new and still trying to figure it all out as well.
I have to learn more about this, very thanks for sharing. Regards!
I want to know about real BTC minor
very much informative post @haejin keep it up
great explaination.. detail, useful and informative.. but I still have to learn more from you about this cryptocurrency.. so keep it up @haejin.. greetings from indonesia