Where We Came From
So as a brief recap, the S&P felt kind of "toppy" in the last update: https://steemit.com/business/@muppetdingdong/the-s-and-p-500-is-outside-of-3-standard-deviations-on-a-40-year-timeline
...where I was discussing standard deviations of the S&P 500 (SPX) and how we had been breaking above some areas that looked to me, having just come off fresh this year from the bitcoin top, kind of unsettling and due for a drop. It happened to also occur on a weekly 9, and multiple daily 9s on the TD sequential indicator (not mentioned in the article, Tone Vays openly noted and I was paying attention to, but I'll pick it up below).
Then, the FED raised rates: https://steemit.com/fomc/@muppetdingdong/care-about-buying-a-house-one-day-fomc-press-conference-september-26-2018-full-video
...and as it turns out, with a sense that this all felt a little toppy among the wider markets, this was the move the stock market finally reacted to. The wider global markets had their own shit to deal with (currency crises, debt crises, political instability, migrant and refugee crises, etc) which didn't help, but the "[debt or stock] bubble" some generally have finally started to talk about or recognize seems to indicate more than a "cyclical sell-off," or an "earnings sell-off." There are signals other analysts are far more qualified to discuss that could have told you this was likely not a normal top, per se.
This is at least partly election re-pricing, the bulls of the market and rich republicans are pricing in a democratic win of the House which if the democrats win, the rich republicans are going to take their ball and go home, presuming a reversal of the tax cuts that are already clearly destroying public trust, inflating the debt, and apart of a plot to destroy social security. More than likely helping to crash the market in the process.
It's difficult to know who to listen to, but I think it's safe to say the American Government can't be trusted to report much of anything truthful when it comes to financial numbers with this administration. It's difficult to not see the way the government is mis— or under—reporting the job numbers, the inflation numbers, the debt numbers whatever...when you're dealing with an administration that IS generally trustworthy and generally has a track record of telling the truth. Hard to trust any of them under this administration at all, at any level, with lying just to lie being the daily norm of the current White House. But I digress...
Which Brings Us to Now—Do we panic or chill?
SPX Monthly Chart: https://www.tradingview.com/x/au6YPQef/
14 EMA (blue) / 30 EMA (orange) / 50 MA (cyan) / 138 VWMA (yellow) / 338 MA (red)
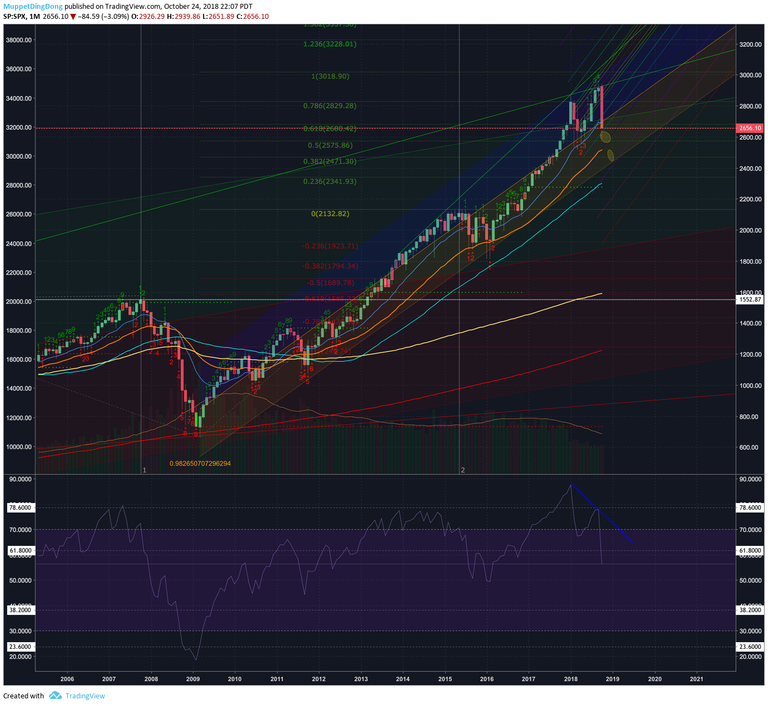
- We have officially broken a key support, breaking through the top of the long term linear regression support in Red and Green
- We have officially broken the midline of the entire 10 year bull run (orange area meeting blue area), this is generally "not good" on a short to mid term basis, suggesting a strong possibility for lower prices, and / or sideways movement
- We have monthly RSI bearish divergence, this is one of the major signals to the broader markets, this was not a top likely to hold or continue, showing at the bottom in purple with the blue line demarcating the divergence. Comparing back to the price line, price goes to higher highs, RSI breaks trend and forms a low. Technically you had the better part of this month to see that forming, granted it's only confirmed on the crash of the price thereafter but...🤦aright...
SPX Weekly Chart: https://www.tradingview.com/x/QMGOz8lm/
14 EMA (blue) / 30 EMA (orange) / 50 MA (cyan) / 138 VWMA (yellow) / 338 MA (red)
The pretty color lines are a pitchfork that represents the fib standard deviations within 1, and increasingly wider standard deviations from the mean. The market seems to obey variations of these lines, but you can see here, the S&P is respecting these lines so they are relevant. Each time we break through one, things get crazy and every time we retest it, it seems to bounce off the upside lines, and is now breaking through the downside lines. With a few horizontal fib lines to form angular support zones, this has seemed to become what we can expect for the stair steps if we continue down.
.png)
- This is clearly all one big move, in a few phases down
- Each time it breaks a line to the downside there's generally a pause, as the RSI cools off, the market gives the air of "this next one will bounce to recovery," clears out all the sellers for a few days, then goes down again
- Weekly 9 signaling a potential top, which was confirmed when price fell below the setup trend line at roughly $2900
- We've officially broken through the 14 / 30 / 50 week averages which now suggests the 138 (yellow line) as a somewhat likely target. 138 is a fib number that seems to be great at marking bottoms and tops of charts on a volume weighted moving average. That is sitting just below $2400 and will approximately follow the purple pitchfork line / the bottom of the orange Linear Regression area of the bull trend (-3 standard deviations) in the coming weeks as the 138 VWMA and 50 MA converge
SPX Daily Chart: https://www.tradingview.com/x/h5t8tOJN/
14 EMA (blue) / 30 EMA (orange) / 50 MA (cyan) / 138 VWMA (yellow) / 338 MA (red)
.png)
- We've broken the Daily 138 VWMA and the Daily 338 MA which is outrageously bearish
- Major support is not particularly close or clear, ~$2580 is the top of the last major support zone, the bottom is $2352 and that is the last stop before major pain and the word "recession" will come back into your daily dialogue on a regular basis again
- We are testing the .382 fib level on the consolidation since last november when trump announced tarriffs and scared the shit out of the market. That .382 fib level technically already broke, the market slightly rebounded back to it, but it's not something likely to hold on the looks of it. The .236 is next at $2612.
Conclusion
To sum up, shit looks dark, the not hilarious part being I got caught in this, wish I listened to my own analysis and every day have something new to learn. Let this stick with you (and I'm mostly writing this for myself) seems kind of basic and hard to exactly quantify but:
*Rising rates means stock prices should go down as earnings go down because the cost of borrowing just went up; the people with billions of dollars on the line are hearing "SELL SELL SELL!!!" out of their risky / growth related positions when the Fed says casually "we're raising rates." This should generally seem obvious and inversely true as well; falling rates means stock prices should generally go up. This is what the Fed is doing when they raise and lower rates, they are manipulating the market prices.
With the bottom falling out at a lot of key points in the chart, unless a major move turn around happens here relatively quickly which is possible but not particularly likely, it suggest short term lower prices in the short term. Sharp turn down in prices will trigger recession talk, and with debt levels where they are for many, who knows what could happen. With tax cut talk still on the table, and given how much corporations and the very rich were given off their tax bill this year, it's hard to truly know the balance or the fate of the S&P in the short / mid term. Throw in an election that is widely regarded as the "most important election of one's lifetime" including presidential elections with Federal Election Conspiracy investigations to be reported on and theoretically acted on.... Asteroid2020 is looking awfully appealing.
Should the Fed come back and say anything about pausing rate hikes, or slowing rate hikes that the market is expecting in late 2018 and 2019, we'll pop back to the upside, less so but somewhat if democrats are an actual check on this administration. Republicans have basically openly stated they're willing to crash the market on a democratic win of either the House or the Senate, on the expectation that taxes will once again rise. And inversely they said they'll basically go into full euphoria mode if republicans win and maintain the house, on the expectation that taxes will continue to lower or stay low. Billionaires will mostly vote with their wallets: "Who will make me the most money the next 4 years?"
But don't trust me, listen to this half hour rant by a fiscal conservative lol:
"Will Fed Capitulation Forestall Stock Market Crash?"
@chartguys doing their analysis:
Just a random dude marking up charts, not a financial expert, don't listen to me for financial advice. If you appreciate the analysis though, give an upvote.