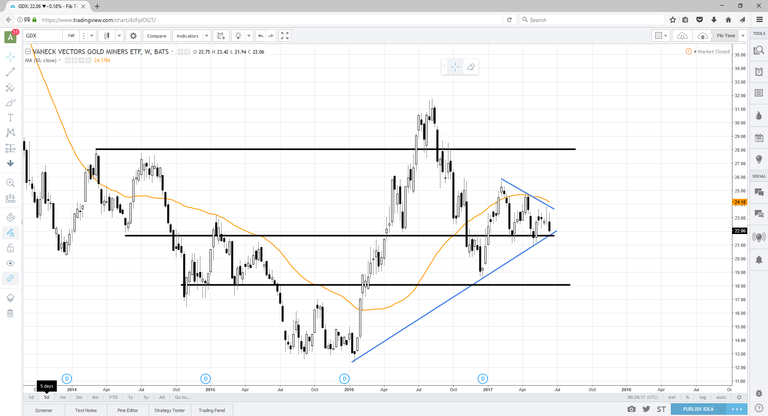
The chart above is of the GDX, gold miners index. Of note is the very large pennant/triangle formation that has been building the last several weeks.
Given the recent action in precious metals I would not be surprised to see this pattern resolve lower, but at the moment we do not have confirmation either way. I suspect a very large move is coming in the near future.
This formation could be a possible opportunity for a long option strangle.
TN Trader
Good eye @tennesseetrader !
Same for the usd/jpy or very similar.
In any circumstances, we have a very good opportunity to make easy, relativity quick money on either side of the triangle. Tps at both support or resistances.
Make green!
For your chart, more % of chances of a break down since their is a bearish triangle just at the edge of the support of the symetrical pattern.