I agree this is going higher. about to close out my naz future short from 1PM.
you have a good one. BTW I see what you are saying that it appears to be a INV H&S nice reversal catch.
chris
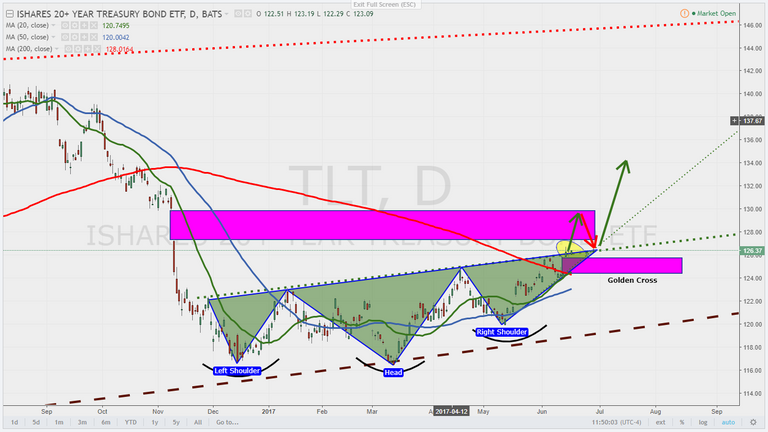
TLT chart... Inverse head and shoulders is VERY BULLISH. So, we should see money pull out of equities and pile into 20-year treasuries (TLT). As for the second chart (TNX), it looks BEARISH which means money pulling out of equities and into treasuries.
hey man, yeah its true there is a ton of stuff on that price chart the Maestro posted, its almost too much to explain, however the concepts arent hard to understand, they are just numerous. Best idea may be to search investopedia.com for key words he uses like "neck line," "chart pattern," "support line," or trend line,
in brief though, so that I may offer some resolution to your question, is that the neck line is the bottom trend line of the head and shoulders pattern, when price breaks it, it is considered a confirmation of the pattern and therefore a good predictor of future price action. Not all patterns are 100% but it seems to me that a head and shoulders pattern, when confirmed, is pretty legit.
TNX BELOW 3rd touch support.
I agree this is going higher. about to close out my naz future short from 1PM.
you have a good one. BTW I see what you are saying that it appears to be a INV H&S nice reversal catch.
chris
could you explain what these graphs are showing in layman's terms? What is the "Neckline"? How do you interpret this? Thanks in advance
TLT chart... Inverse head and shoulders is VERY BULLISH. So, we should see money pull out of equities and pile into 20-year treasuries (TLT). As for the second chart (TNX), it looks BEARISH which means money pulling out of equities and into treasuries.
Do you think this pullback out of equities also relevant for Miners and PM? What are your thoughts on that?
Thx!
that's a fine explanation - thanks for taking the time maestro :D
hey man, yeah its true there is a ton of stuff on that price chart the Maestro posted, its almost too much to explain, however the concepts arent hard to understand, they are just numerous. Best idea may be to search investopedia.com for key words he uses like "neck line," "chart pattern," "support line," or trend line,
in brief though, so that I may offer some resolution to your question, is that the neck line is the bottom trend line of the head and shoulders pattern, when price breaks it, it is considered a confirmation of the pattern and therefore a good predictor of future price action. Not all patterns are 100% but it seems to me that a head and shoulders pattern, when confirmed, is pretty legit.
let me know if this helps
Followed & Upvoted
Follow back please :) and upvote one of my blogs thankyou ;)
@thecrytotrader