Consider this post more of a data dump of market information about UNTAMED cards in the market.
The new data given in BULK really help give a sense for how the market of untamed cards is doing.
Spoiler... there aren't a lot of cards listed yet... even with as many packs as have been opened it seems people are keeping the cards and not listing very many.
You can also get a sense for which are the most popular cards with this data.
NOTE: This information was mostly done by hand using https://peakmonsters.com/ tools by @jarvie. If anyone is interested in doing this themselves in the future happy to inform them as this exercise will likely not be repeated anytime soon.

THE DATA
- You can grab the data and put it into a spreadsheet and organize it if you want.
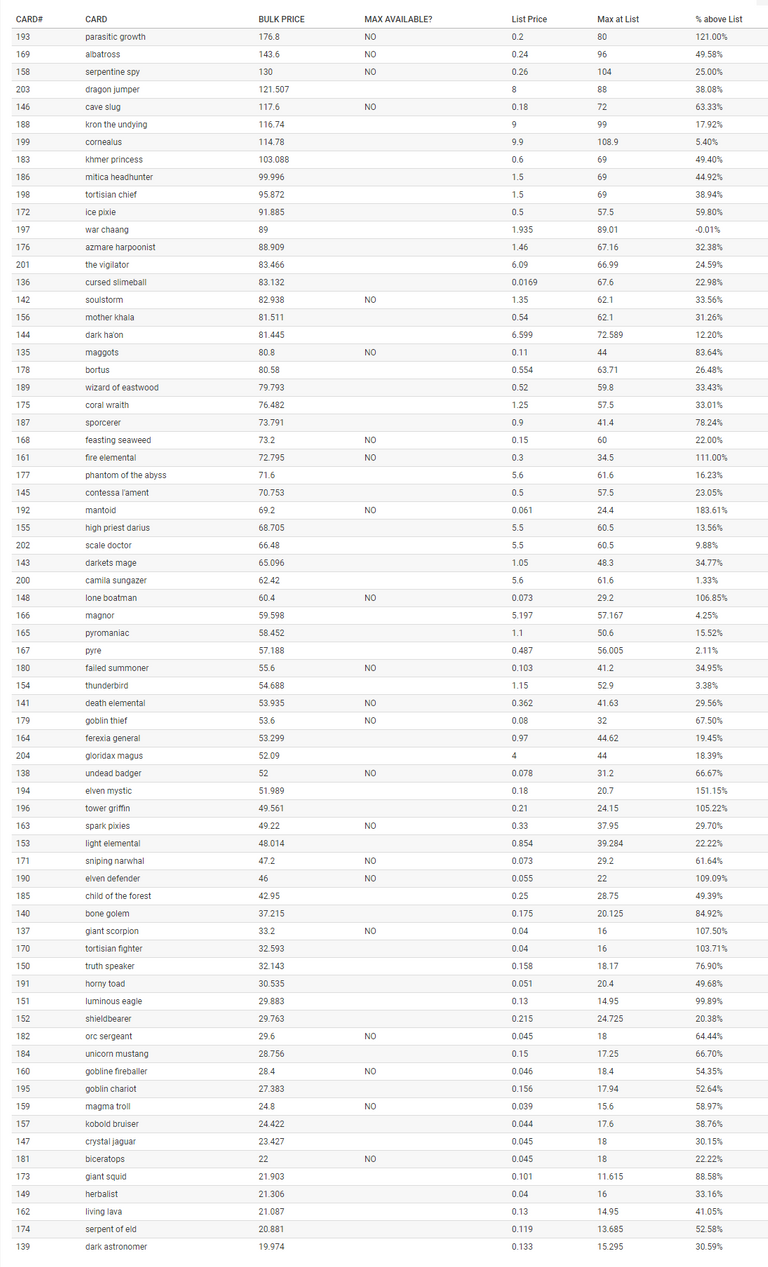
- I have it sorted by BULK PRICE ... meaning the cost if you were to buy a max from the market right this second.
- But note that 22 cards don't even have enough cards listed to get a max card... in those cases the price of max is extrapolated from the highest average price from the level that is available
- The above list % ... is a good indicator that the card is oversold aka under listed and that the listings that are there are likely way higher than normal
- Low above list % means that the average price at max is very similar to the list price and the price per card does not tend to quickly shoot up after a few levels of the card.
| CARD# | CARD | BULK PRICE | MAX AVAILABLE? | List Price | Max at List | % above List |
|---|---|---|---|---|---|---|
| 193 | parasitic growth | 176.8 | NO | 0.2 | 80 | 121.00% |
| 169 | albatross | 143.6 | NO | 0.24 | 96 | 49.58% |
| 158 | serpentine spy | 130 | NO | 0.26 | 104 | 25.00% |
| 203 | dragon jumper | 121.507 | 8 | 88 | 38.08% | |
| 146 | cave slug | 117.6 | NO | 0.18 | 72 | 63.33% |
| 188 | kron the undying | 116.74 | 9 | 99 | 17.92% | |
| 199 | cornealus | 114.78 | 9.9 | 108.9 | 5.40% | |
| 183 | khmer princess | 103.088 | 0.6 | 69 | 49.40% | |
| 186 | mitica headhunter | 99.996 | 1.5 | 69 | 44.92% | |
| 198 | tortisian chief | 95.872 | 1.5 | 69 | 38.94% | |
| 172 | ice pixie | 91.885 | 0.5 | 57.5 | 59.80% | |
| 197 | war chaang | 89 | 1.935 | 89.01 | -0.01% | |
| 176 | azmare harpoonist | 88.909 | 1.46 | 67.16 | 32.38% | |
| 201 | the vigilator | 83.466 | 6.09 | 66.99 | 24.59% | |
| 136 | cursed slimeball | 83.132 | 0.0169 | 67.6 | 22.98% | |
| 142 | soulstorm | 82.938 | NO | 1.35 | 62.1 | 33.56% |
| 156 | mother khala | 81.511 | 0.54 | 62.1 | 31.26% | |
| 144 | dark ha'on | 81.445 | 6.599 | 72.589 | 12.20% | |
| 135 | maggots | 80.8 | NO | 0.11 | 44 | 83.64% |
| 178 | bortus | 80.58 | 0.554 | 63.71 | 26.48% | |
| 189 | wizard of eastwood | 79.793 | 0.52 | 59.8 | 33.43% | |
| 175 | coral wraith | 76.482 | 1.25 | 57.5 | 33.01% | |
| 187 | sporcerer | 73.791 | 0.9 | 41.4 | 78.24% | |
| 168 | feasting seaweed | 73.2 | NO | 0.15 | 60 | 22.00% |
| 161 | fire elemental | 72.795 | NO | 0.3 | 34.5 | 111.00% |
| 177 | phantom of the abyss | 71.6 | 5.6 | 61.6 | 16.23% | |
| 145 | contessa l'ament | 70.753 | 0.5 | 57.5 | 23.05% | |
| 192 | mantoid | 69.2 | NO | 0.061 | 24.4 | 183.61% |
| 155 | high priest darius | 68.705 | 5.5 | 60.5 | 13.56% | |
| 202 | scale doctor | 66.48 | 5.5 | 60.5 | 9.88% | |
| 143 | darkets mage | 65.096 | 1.05 | 48.3 | 34.77% | |
| 200 | camila sungazer | 62.42 | 5.6 | 61.6 | 1.33% | |
| 148 | lone boatman | 60.4 | NO | 0.073 | 29.2 | 106.85% |
| 166 | magnor | 59.598 | 5.197 | 57.167 | 4.25% | |
| 165 | pyromaniac | 58.452 | 1.1 | 50.6 | 15.52% | |
| 167 | pyre | 57.188 | 0.487 | 56.005 | 2.11% | |
| 180 | failed summoner | 55.6 | NO | 0.103 | 41.2 | 34.95% |
| 154 | thunderbird | 54.688 | 1.15 | 52.9 | 3.38% | |
| 141 | death elemental | 53.935 | NO | 0.362 | 41.63 | 29.56% |
| 179 | goblin thief | 53.6 | NO | 0.08 | 32 | 67.50% |
| 164 | ferexia general | 53.299 | 0.97 | 44.62 | 19.45% | |
| 204 | gloridax magus | 52.09 | 4 | 44 | 18.39% | |
| 138 | undead badger | 52 | NO | 0.078 | 31.2 | 66.67% |
| 194 | elven mystic | 51.989 | 0.18 | 20.7 | 151.15% | |
| 196 | tower griffin | 49.561 | 0.21 | 24.15 | 105.22% | |
| 163 | spark pixies | 49.22 | NO | 0.33 | 37.95 | 29.70% |
| 153 | light elemental | 48.014 | 0.854 | 39.284 | 22.22% | |
| 171 | sniping narwhal | 47.2 | NO | 0.073 | 29.2 | 61.64% |
| 190 | elven defender | 46 | NO | 0.055 | 22 | 109.09% |
| 185 | child of the forest | 42.95 | 0.25 | 28.75 | 49.39% | |
| 140 | bone golem | 37.215 | 0.175 | 20.125 | 84.92% | |
| 137 | giant scorpion | 33.2 | NO | 0.04 | 16 | 107.50% |
| 170 | tortisian fighter | 32.593 | 0.04 | 16 | 103.71% | |
| 150 | truth speaker | 32.143 | 0.158 | 18.17 | 76.90% | |
| 191 | horny toad | 30.535 | 0.051 | 20.4 | 49.68% | |
| 151 | luminous eagle | 29.883 | 0.13 | 14.95 | 99.89% | |
| 152 | shieldbearer | 29.763 | 0.215 | 24.725 | 20.38% | |
| 182 | orc sergeant | 29.6 | NO | 0.045 | 18 | 64.44% |
| 184 | unicorn mustang | 28.756 | 0.15 | 17.25 | 66.70% | |
| 160 | gobline fireballer | 28.4 | NO | 0.046 | 18.4 | 54.35% |
| 195 | goblin chariot | 27.383 | 0.156 | 17.94 | 52.64% | |
| 159 | magma troll | 24.8 | NO | 0.039 | 15.6 | 58.97% |
| 157 | kobold bruiser | 24.422 | 0.044 | 17.6 | 38.76% | |
| 147 | crystal jaguar | 23.427 | 0.045 | 18 | 30.15% | |
| 181 | biceratops | 22 | NO | 0.045 | 18 | 22.22% |
| 173 | giant squid | 21.903 | 0.101 | 11.615 | 88.58% | |
| 149 | herbalist | 21.306 | 0.04 | 16 | 33.16% | |
| 162 | living lava | 21.087 | 0.13 | 14.95 | 41.05% | |
| 174 | serpent of eld | 20.881 | 0.119 | 13.685 | 52.58% | |
| 139 | dark astronomer | 19.974 | 0.133 | 15.295 | 30.59% |
THE IMAGE
In case you want a picture version here it is. Use steempeak to click and view larger.

Is there a way someone such as myself can get this data on my own, or just something you can easily pull through running peakmonsters?
I did it with a spreadsheet and checking out the totals provided in the BULK calculator. And then for LIST stuff just took the low list price X whatever equals max. It's some work by hand... but if you want the info to analyse that no one else has (because of laziness) then you have to put in the time.
Yeah I've been pulling all the data manually and it's definitely doable, but just takes a while. Just looking for some way to streamline the data gathering so I can spend more time analyzing.
The best new tool that saves a lot of time is found when you click this little button
could you explain me better the %above list stats?
thanks
Taking the difference between MAX on market and MAX calculated by LIST price. Aka it's the increase. It basically is an indicator that there isn't much available in the market and that the price shoots up pretty quickly. Meaning it is a fast way to understand the depth of the market.
Would you guys have any interest in adding an Analytics section where users can get some more detailed stats & specifics relative to their collection and how it's used in battles? Maybe make it a perk for guild members or people who use the your marketplace...
This post goes into some more detail specific to defensive ratings and gives an example about the idea. https://steemit.com/splinterlands/@bp9930/splinterlands-saturday-defense
Getting an data driven idea as to your most efficient cards in various scenario's could be a nice advantage once guild wars / tournaments get up and running.