
SUMMARY
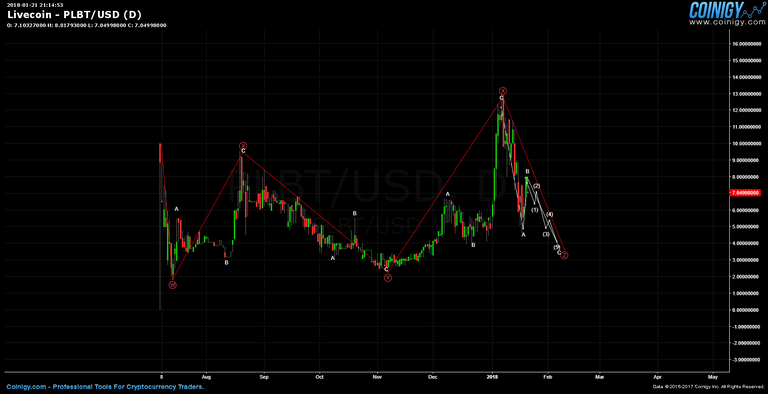
Polybius (PLBT) is labeled using the triple combo wxyxz and its subwaves have been filled in. IF this count is correct, then PLBT could be in the final stretch of this very long and drawn out sideways movement. The white subwaves provide a potential direction for the one more lower low.
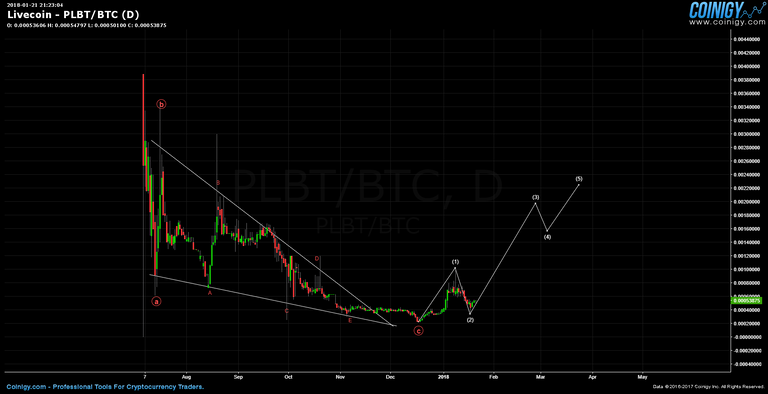
The PLBT/BTC is showing a nice descending triangle pattern and price could be starting to impulse and if so, the demand for the coin could exceed that of the rate of change in Bitcoin.
Legal Disclaimer: This is only my opinion, make of it what you wish. What does this mean? It means it's not advice nor recommendation to either buy or sell anything! It's only meant for use as informative or entertainment purposes.
Please consider reviewing these Tutorials on:
Elliott Wave Counting Tutorial #1
Elliott Wave Counting Tutorial #2
Elliott Wave Counting Tutorial #3
Laddering and Buy/Sell Setups.
Laddering Example with EOS
Tutorial on the use of Fibonacci & Elliott Waves
These Technical Analysis Books: Elliott Wave Priniciple & Technical Analysis of Stock Trends are highly recommended
@haejin's Trading Nuggets
Essay: Is Technical Analysis a Quantum Event?
Follow me on Twitter for Real Time Alerts!!
Follow me on StockTwits for UpDates!!
--
--

If this blog post has entertained or helped you to profit, please follow, upvote, resteem and/or consider buying me a beer:
BTC Wallet - 1HMFpq4tC7a2acpjD45hCT4WqPNHXcqpof
ETH Wallet - 0x1Ab87962dD59BBfFe33819772C950F0B38554030
LTC Wallet - LecCNCzkt4vjVq2i3bgYiebmr9GbYo6FQf

FIRST!
Nice man congrats.
Lovely day! :) I am followed u. :)
GREAT POST!
Build that base and then expand toward the next target!
Hallo Haejin, thanks to your teaching I came to this chart. What do you think ?
Yes, that's the flag pattern and if price breaches the upper line of the wedge, you blue 4 would be the next stop. Tough, I'd label with a,b,c,d,e
Nice post! Really like ur profile :)
i think haejin's count is more likely sa the 7 day moving average(white wave) failed to cross the 77 day moving average (blue wave).
great info in detail
Chart shows around 6500. I just extended the fractals and came to this chart. From there it should impuls to 20k. However i'm not an expert so we need input from Haejin on this one. @salahuddin2004 thinks it does not go below 10k. However everyone agrees long term trend is up at least towards 20k. This means 2x current levels and alt coins would easily 3x in my opinion. So if you do not want to micro trade the waves you can just sit back and relax.
I thought this was ur face , asshole , shall I whip you with a long piece of meat attached to me ?
Why don’t you eat my hairy balls 🎾?
I sold my tokens a long time ago, wish I had held on!
A good trader is always a bad trader who forgives himself for the mistake, learns his lessons and tries again.
Nice information....
Thanks @haejin
good!!
muy buen post bastante informativo
Wow very nice post
Muchas gracias por compartir tus análisis
O m g If i have that.. love it..
Very interesting information, good luck and good luck.
hello dear your poste is very important for me i give you up vote & FLOW YOU GIVE ME UP VOTE FLOW & RESTIME MY POST BECOUS YOU & ME ALL ARE STEEMIT WORKER
https://steemit.com/picture/@thawfiqur/picture-ar-passi-na-dilam-aita
Wow man. You're making a killing on here. Any advice?
love your work Can u do cnd This is most undervalued crypto on market if you understand it Thanks
Hey @haejin, your the best
I propose a solution to the haejin upvote abuse. Make it so that there is a non-linear reward scheme for people, meaning it takes exponentially more SP to get higher rewards the higher your reward is. At first the increase in MVests will be gradual but overtime it will become very vast and obvious, like basically make a soft limit of $100 reward on posts or something
Looks like a takeoff has started!
good post haejin!
Oh, god. Now there are two consummate spammers? You know I might want to read comments without scrolling through all your doo!
Please stop.
We're trying to build biggest pump and dump group ever, i'm pretty sure everyone here knows how pump and dump group works so... If you want to feel fast profits ( We're aiming for 1000% + first one ), feel free to jump in! 🚀
⚡️https://t.me/PumpKingzz
Message me @danielcrypto1 so u can be first one to know which coin we'll pump!
This post very nice
I am sorry sir... i don't understand this post.i very very sorry this comments.. please withdrawn your flag.
I like the way you think about charts etc. appreciate that you're sharing your opinion!
I Like this! Please visit https://steemit.com/buddha/@pankajwahane/noble-intention-behind-steemit