Over the whole time I've spent learning to DeepRace, I kept mentioning how log analysis was important to me. Let me expand on it a little bit.
Log analysis
I wrote a post about analysing the logs with use of the log-analysis tool provided by AWS in their workshop repository (I recommend following the workshop as well, it's pretty good and kept up to date). If you would like to have a look at what the tool offers out of the box, you can view either install Jupyter Notebook as I described in the previous post, or see it in a viewer on GitHub.
What I have learned from the tools provided
The default DeepRacer Log Analysis.ipynb notebook is a bit of a mess, having bits of code in external files, some methods in the notebook, some bits to check the training, some to check evaluation. I think this was on purpose - one of those almost finished tools, written in a way to expose bits of technology and implementations, leaving other bits missing.
The tools I have learned from it so far are:
- Jupyter Notebook (duh)
- Pandas - data series analysis, grouping, querying, processing and visualising
- Bit of Numpy - everything maths
- Pyplot - visualising the graphs
- Tiny bit of Boto3 - interaction with CloudWatch (AWS logs solution) and S3 (AWS storage)
- Bits of things here and there
It was perfect to get started, and so I did, and then I started adding graphs, tables, calculations, functions, I cleaned it up a little, split it a bit. I would now like to share.
My log analysis
My version of the project is available on my workshop fork on GitHub. Below I will try to describe all changes I have prepared.
First of all I added a README.md with useful info on how to prepare for working with log analysis and what can be contributed to the new version. It isn't very detailed, but at least lets you know what to install before. Very basic Python knowledge is a prerequisite to using it.
I have moved some of the code from the original notebook into three python files:
cw_utils.pyslightly extended, it has methods to load logs from CloudWatchlog-analysis.pymuch extended, contains code used for loading, analysing, grouping, extending and visualising the datatrack_utils.pynew file, contains code used for loading and plotting the tracks
I have also added track files for the New York race, both training and evaluation. The evaluation one has been prepared in cooperation with Kim Wooglae of the AWS DeepRacer Community. You can join the community at any time using the link at the end of this article. Kim extracted the track coordinates from an image on the race page, I converted them into an npy file. These and other track files are used for plotting the track so that one can watch the car's journey with relation to the environment.
Finally, I have added two new notebooks. I decided to leave the old one intact as it is very useful for newstarters. If this is your first time with DeepRacer's logs, I still recommend you get familiar with the original notebook first.
Training analysis
The Training_analysis.ipynb is what I use for loading and reviewing the training results.
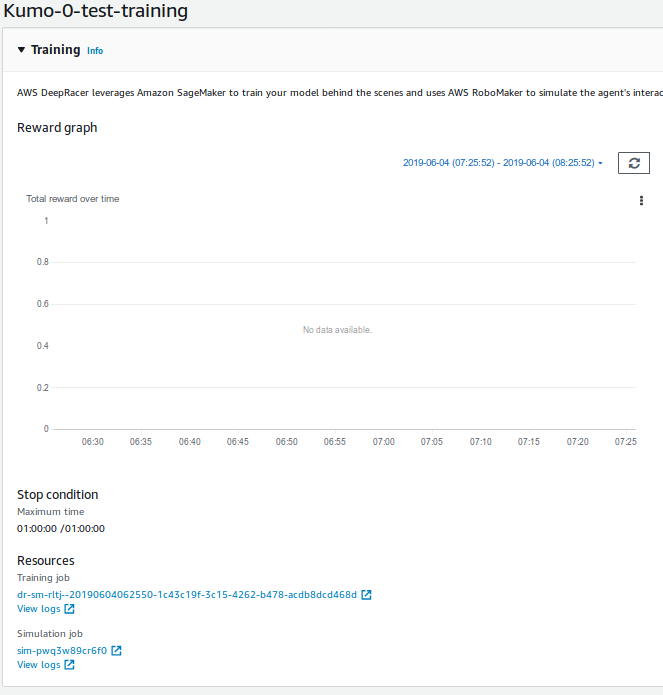
Selecting the logs to analyse
All you need to do is to get the training id available under a header "Simulation job" in the "Training" section of the training:
Then paste it into line
stream_name = 'sim-sample' ## CHANGE This to your simulation application ID
fname = 'logs/deepracer-%s.log' %stream_name
in your notebook, then execute this and the download block below.
If you are using local training as described by Chris Rhodes, you can do what I do:
docker logs dr > a_log_file.log
and then
fname = 'path/to/a_log_file.log'
Then while the training is continuing I just repeat docker logs and rerun parts of the notebook.
By default the log file is only downloaded if a filename does not exist. To change that behaviour you need to add force=true as a parameter to function call cw.download_log. The default behaviour will save you quite some bandwidth.
Loading the logs
Here you need to remember to set EPISODES_PER_ITERATION to a value you used in your hyperparameters. Otherwise your iterations will not be numbered properly.
Hint: if you want to use some intermediate checkpoints in your training/evaluation, the one that gives you results as in iteration X is numbered with (X-1)_Step. Don't worry if this tells you nothing, this is for people who already jumped into the details of training tools.
When you execute this code, logs are loaded and converted to their pandas representation. This is pretty much only loading the log lines that contain some information about each step.
Training progress
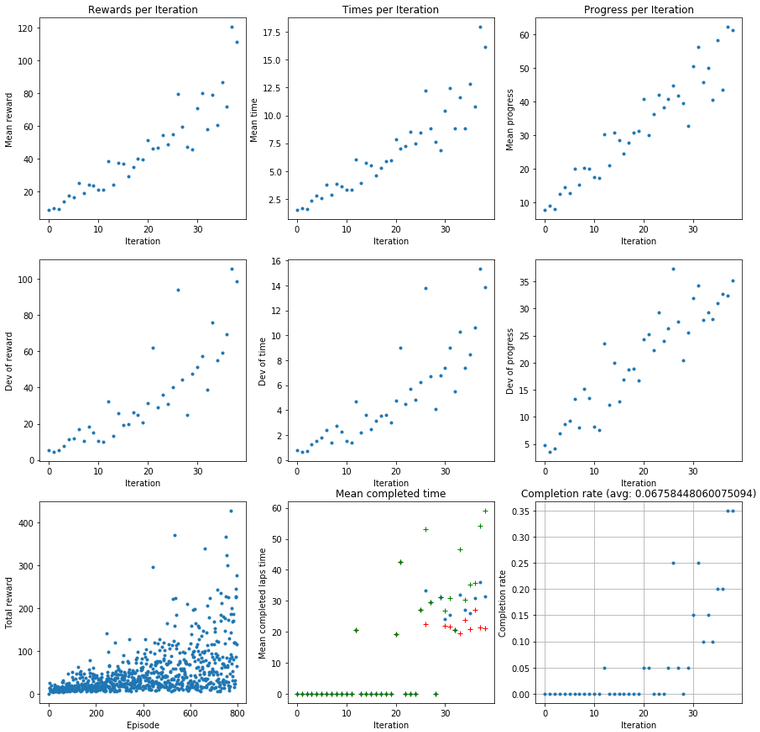
la.analyze_training_progress(df, EPISODES_PER_ITERATION) uses this information to visualise how the training is progressing. This is based on the "Plot rewards per Iteration" part of the original notebook. It was providing a plot of rewards per iteration and the deviation of those values, and also some information on total reward per episode.
The original data can show progress of training, but under one condition: your reward function is rewarding what you think it is. Let's say you reward your car to go on high throttle:
if params['speed'] < 5:
    reward = 0.5
else:
    reward = 1.0
One of the issues currently is that speed in action space or in logs is not speed, it's more of a throttle. The car accelerates and slows down and I haven't seen any analysis of the physics behind it yet.
The units are also off for it. From the code (Thanks to Jochem Lugtenburg and Jasper De Moor for looking more into this) it looks like the assumption is that speed is in rpm, but it might be actually sent to the car as radians per second, and the wheel radius is set to 0.1m. I couldn't get the calculations to work for this, but I empirically know the car could at maximum values reach an average speed (real speed) of 2m/s. This needs more understanding.
It will use higher throttle values, but at the same time it will wobble around the track as longer distance means more steps and more steps means more speed reward.
That's why I added two more Mean values with deviation:
- Mean time per iteration
- Mean progress per iteration
If your model is reasonably stable and completes laps regularly, the time values will matter more to you. On the other hand, if it is struggling to complete a lap, progress may shed some light on how good your car is doing. There's also an added extra to this: if any of the mean graphs looks like this:
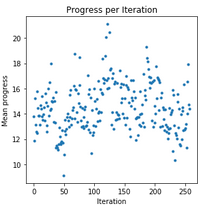
Then chances are your learning rate is too high and your model is jumping around some local maximum instead of converging. Extract a model from one of the peaks, lower your learning rate and carry on.
If you are getting complete laps, I have added two more graphs for you: Mean completed laps time per iteration will show you the
- average (blue dot)
- maximum (green cross)
- minimum (red cross)
time for completed laps in an iteration. If there are no completed laps, the values plotted are zero.
The completion rate gives you an idea about how stable your model is based on the laps it manages to complete. In the header you get a full training average of complete laps and the graph shows that withing iterations. A word of caution though, if your car is more stable, it's quite likely that you laps are slower. The car tends to slow down with more laps completed.
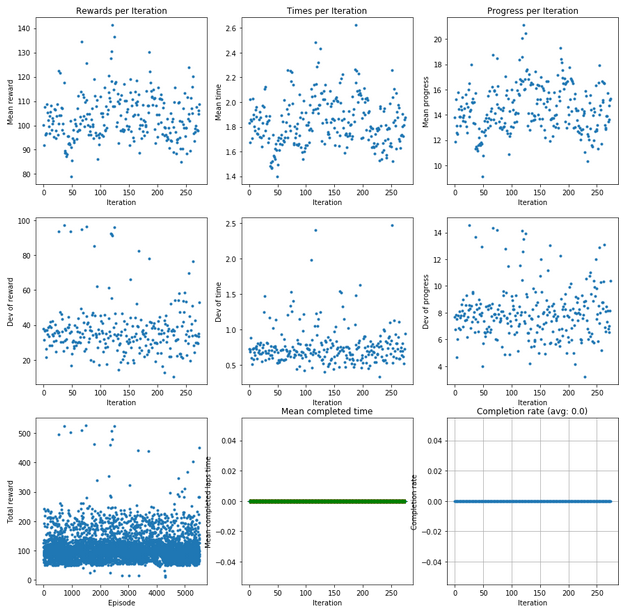
This little model is not super awesome at completing a lap.
Slow, but getting somewhere
About the completed time: There is one drawback when it comes to the logs: the first log entry is written already after the episode had started. This means the first step has non-zero progress and non-initial timestamp. Long story short: before you get super enthusiastic about your time, add roughly 0.2 s to it. Then get super enthusiastic.
Simulation aggregates
We've already discussed looking at specific log steps, but frankly speaking, they are useful for some basic analysis and plotting the laps on the graph. I think the real magic kicks in when you add a bit of extras.
Pandas lets you group the logs and so I have: I grouped by episode and prepared some new information per episode:
- steps performed
- starting waypoint (start_at)
- overall progress
- time (without initial 0.2s)
- new reward (I'll cover that later)
- average throttle
- overall reward
- time if the lap was to be completed (without initial 0.2s)
- reward if the lap was to be completed
- quintile (more about this in a bit)
That sounds like some pretty damn useful info about episodes, right?
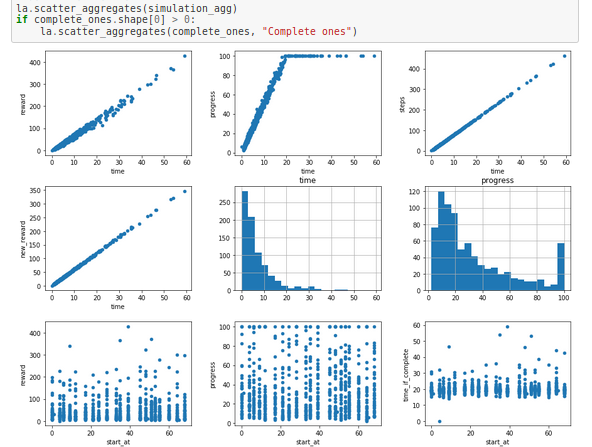
Now check out the graphs:
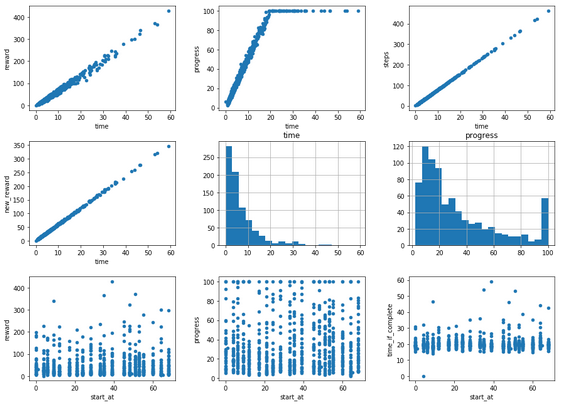
- time based graphs - show the dependency between reward, progress and steps count and the time
- time and progress histograms - give you some idea about the model's preformance
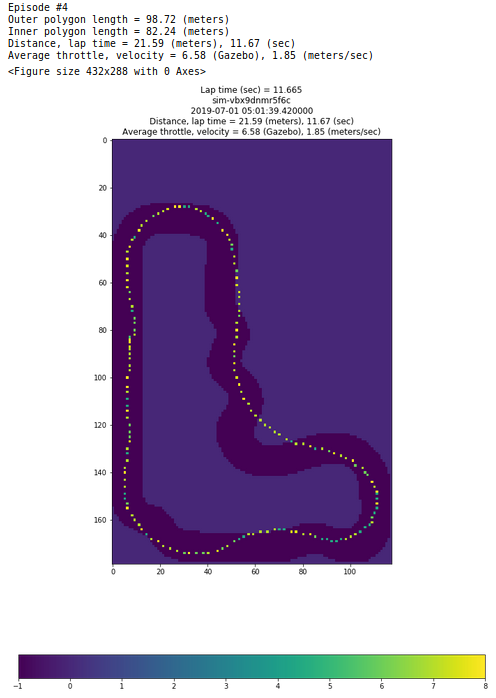
- waypoints graphs - my favourite ones, showing how your car is performing depending on where it starts the lap.
The last ones I like the most since they can show you where your model struggles:
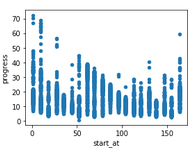
This car is clearly struggling to get past something on the track.
These graphs are plotted for all episodes and for the complete ones if there are any. I use the reward to time graph on complete laps to evaluate my reward function performance.
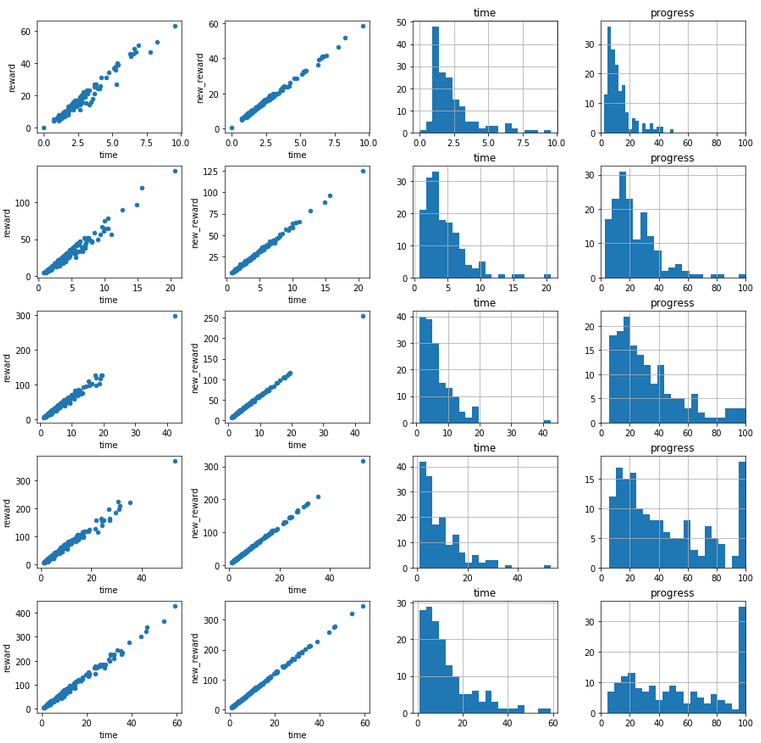
Categories
In the aggregation function I have assigned the episodes to five equal buckets based on the episode value. These are handy to also point some progress in the training:
Charts, charts everywhere
The next part of the notebook are various charts: highest rewards, lowest time, most progress etc. Some of them will draw your attention to valuable episodes, others are there just as examples for when you want to dig into a tiny part of the data.
They are followed by a histogram of rewards per closest_waypoint. It lets me drill more into a particular iteration to detect where my car gets penalised or rewarded extra.
Plots
I don't look at the plots much.
I like the ones for top reward iterations as they show the path around the track during the training for best performances.
The next one shows the reward distribution around the track.
Then you get particular episode and iteration. I use the first one if I get more curious about a particular attempt.
Bulk training load
When I used to train mostly through console, I prepared this set of functions that would let me download and then bulk load all the trainings to understand and analyse the data in bulk. It was quite helpful when improving my reward function. It also has an option to aggregate the data per simulation/log stream and to save the loaded data as a pickle on drive to load it again later.
Action breakdown
I've spent some time trying to generalize this function to be able to plot it for other tracks, not only Reinvent one. I prepared something for the Reinvent track and for the London Loop, but it is far from complete or satisfactiory. I will be trying to understand it more and to focus on reworking the track info used in the log analysis notebooks.
Evaluation analysis
The Evaluation_analysis.ipynb is what I use for loading and reviewing the analysis results.
Frankly speaking, the key part of it is bulk load of data, followed by aggregation, the graphs known from Training_analysis.ipynb and some charts to view a couple details. I also like looking at plotting of the evaluation laps. Note that they take a lot of time to plot (I guess I should have looked into the method to understand what takes so long; opportunity for improvement), so I have added minimum distance parameter which I normally set to something close to 100 procent of the track length.
The next entries are about a single evaluation which I don't really use.
New reward
This I think is a killer feature which, once you manage to use it, will:
- save you loads of time
- save you loads of resources
- give you a better reward function letting you hope for a good performance in the race.
It does however have some issues as well. I will list them at the end.
So I thought to myself: if the logs have pretty much everything needed to set the params for the reward function, why now try and replay them?
The idea is to be able to take the logs, recreate params (and time) using them, and finally apply a reward function, place it in the data series and plot the new values alongside the old ones.
This required some preparation. Let's start with
Reward class
I needed a way to import a new reward function on demand, to store some state in it (yes, you can store state with reward function) and to be able to effortlessly use it in the console and local training.
I knew it was possible to use global variables to hold state between the reward function calls. I decided to try and create a reward class which would hold state in an instance. Then in the reward code I would instantiate it and declare a reward function calling:
reward_class_instance.reward_function(params)
So I gave this a try and wrote a sample reward function rewarding avoiding big turns:
from time import time


class Reward:
    def __init__(self, verbose=False):
        self.previous_steps = None
        self.initial_time = None
        self.verbose = verbose

    @staticmethod
    def get_vector_length(v):
        return (v[0] ** 2 + v[1] ** 2) ** 0.5

    @staticmethod
    def vector(a, b):
        return b[0] - a[0], b[1] - a[1]

    @staticmethod
    def get_time(params):
        # remember: this will not return time before
        # the first step has completed so the total
        # time will be slightly lower
        return params.get('timestamp', None) or time()

    def reward_function(self, params):
        if self.previous_steps is None \
                or self.previous_steps > params['steps']:
            # new lap!
            self.initial_time = self.get_time(params)
        else:
            # we're continuing
            pass

        steering_factor = 1.0

        if abs(params['steering_angle']) > 14:
            steering_factor = 0.7

        reward = float(steering_factor)

        self.previous_steps = params['steps']

        if self.verbose:
            print(params)

        return reward


reward_object = Reward()


def reward_function(params):
    return reward_object.reward_function(params)
I put two helper methods there for working with vectors, and one important method to deal with time - if you want to look at the time in your function, you need to use it as while recreating the params dictionary I add timestamp to it to use the value from logs instead of the one from time.time(). Anyway, I tested this, it works in console, it works in local training, it works when replaying the reward.
Dynamic import of reward function
Second thing, I needed a way to import a reward function into the notebook. Whoever works on the importlib: I'm your fan.
import importlib
importlib.invalidate_caches()
rf = importlib.import_module(reward_module)
importlib.reload(rf)

reward = rf.Reward(verbose=verbose)
So I may be doing too much here, but this way I'm sure that every time I import a reward_module provided as a string, for instance 'reward.reward_sample', I make an assumption that Reward class is declared in there and the just run it as in the example above.
Params
So now the third thing: params. I had to do some maths to get them going, but it worked reasonably well.
I take each line from logs (pandas DataFrame), do some overly complicated maths, put it in a dictionary, extend with timestamp and feed it into the reward function.
Putting the new_reward back together
In the Training_analysis notebook you'll find a line:
la.new_reward(df, l_center_line, 'reward.reward_sample') #, verbose=True)
This loads the reward function, the dataframe, the center line of the track and puts new reward values in new_reward field of the dataframe.
If it's not called, regular reward value is assigned to that column so that it's not missing.
As a result if you think the reward is not what you intended, if you have a new idea for a reward function, just write it and feed into the notebook to get an approximation of what the outcome would be. I'd say it's faster than trying a reward function for an hour or two to find there was a problem with it.
Issues with new reward
There are some problems with the way new_reward works:
- loss of precision - logs store truncated values of params and so I have seen some big changes to reward when I applied same reward function for a replay. Just remember it doesn't give exact values, more an idea of what they would be like,
- time consuming - if you have a couple thousand episodes, it will take long to calculate. It's generally slow. I would suggest you comment it out if not in use,
- some params missing (or miscalculated) - I haven't finished it. I left out the values I didn't use at the time of writing. You can add them yourself. Contributions are very much welcome.
Conclusions
I haven't included all ideas from the initial notebook in my versions. The heat maps sound like something one could learn from (highlighting areas of interest on an image based on an action being considered). Jochem Lugtenburg from the community is working on a kick-ass video generator with heat maps highlighter. Watch his space - he might release something.
I believe this is a complete change now, I have therefore raised Pull Request to AWS workshop repository. Let's see if they find it worth merging.
UPDATE 20.07.2019 I have improved the analysis by a bit, mainly focusing on the speed of computations. Read here.
Feedback, Contribute
Such tools are as good as their users make them. Let me know what you think. Show me what you have problems with. Raise Pull Requests on GitHub. Share your ideas for analysis. For instance, I believe Chris Mack from the community has updated it to run two log analysis side by side.
Some things are being done inefficiently and require a rewrite. Maybe you can offer some improvement?
How to join the race
Check this post for links to valuable resources. There you will find information on what is involved etc.
Community
A big shout out to the global AWS DeepRacer community. We are a bunch of enthusiasts learning, racing, competing and having fun together. On board you will find professionals and new starters, many highly ranked folks from AWS Summits and virtual races, including holders of the golden ticket to Willy Won AWS re:Invent 2019.
You are very welcome to join, ask questions, contribute and have fun together: invitation link to Slack.
Race on!