Script is here.
This is a simple R script to keep track of crypto investment. The script enables user to record and track investments with two functions:
add_trade()
with which user can record transactions, e.g., deposit, withdraw or exchange. And
portfolio_value()
which evaluates real time portfolio value in user specified crypto or fiat currency. We'll create a function to make naive price prediction as well as the two functions mentioned.
First, check if required packages are installed. If not, install them:
if (!require("jsonlite")) install.packages("jsonlite")
if (!require("dplyr")) install.packages("dplyr")
if (!require("ggplot2")) install.packages("ggplot2")
if (!require("forecast")) install.packages("forecast")
if (!require("plotrix")) install.packages("plotrix")
It's a good practice save trade history in disk. We'll save it as .csv file which allows analysis using other software as well. The below code chunk checks if there's a file named trade_histoy.csv in user's working directory. If not, the code will create one. Issue getwd() to see current working directory and setwd(<directory path>) to set working directory.
if(!file.exists("trade_history.csv")){
  trade_history <- data.frame(type=factor(levels = c("deposit", "wtihdraw", "exchange")),
                              deposit_amount=double(),
                              deposit_currency=factor(),
                              withdraw_amount=double(),
                              withdraw_currency=factor(),
                              exchange_name=character(),
                              remark=character(),
                              date=character(), # year-month-day format eg 2017-07-18
                              stringsAsFactors=FALSE)
  write.csv(x = trade_history, file = "trade_history.csv", sep = ",", row.names = FALSE)
}
We inspect what our old or newly created trade_history.csv contains. First load the data with read.csv() function, store that data in an R variable named trade_history and see top few rows of that R variable with head(trade_history:
trade_history <- read.csv(file = "trade_history.csv", header = TRUE, sep = ",")
head(trade_history)
Output of head(trade_history) is:
[1] type              deposit_amount    deposit_currency  withdraw_amount   withdraw_currency exchange_name     remark            date
<0 rows> (or 0-length row.names)
Since we haven't yet entered any trade/transaction, it's a dataset with 0 rows. Lets create the function named add_trade() so we can add transactions easier:
add_trade <- function(type, deposit_amount = 0, deposit_currency = NA,
                      withdraw_amount = 0, withdraw_currency = NA, exchange_name = NA,
                      remark = NA, date = NA) {
  new_trade <- data.frame(type, deposit_amount, deposit_currency,
                          withdraw_amount, withdraw_currency, exchange_name, remark, date)
  read.csv(file = "trade_history.csv", header = TRUE, sep = ",") %>%
    rbind(new_trade) -> "trade_history"
  write.csv(x = trade_history, file = "trade_history.csv", sep = ",", row.names = FALSE)
  assign(x = "trade_history", trade_history, envir = globalenv())
}
Now add a few transactions with the function add_trade() we just created:
add_trade(type = "deposit", deposit_amount = 0.2, deposit_currency = "BTC", remark = "gift from brother", date = "2017-07-01")
add_trade(type = "deposit", deposit_amount = 5, deposit_currency = "XMR", remark = "purchased", exchange_name = "poloniex", date = "2017-07-02")
add_trade(type = "deposit", deposit_amount = 1, deposit_currency = "ETH", remark = "mining reward", date = "2017-07-05")
add_trade(type = "deposit", deposit_amount = 200, deposit_currency = "STEEM", remark = "Steemit rewarrd", date = "2017-07-06")
add_trade(type = "trade", deposit_amount = 1.1, deposit_currency = "ZEC", withdraw_amount = 0.1, withdraw_currency = "BTC", remark = "Exchanged BTC for ZEC", date = "2017-07-09")
add_trade(type = "trade", deposit_amount = 4.6, deposit_currency = "ETC",  withdraw_amount = 2, withdraw_currency = "XMR", remark = "Exchanged XMR ETC", date = "2017-07-10")
add_trade(type = "trade", deposit_amount = 65, deposit_currency = "EOS",  withdraw_amount = 0.5, withdraw_currency = "ETH", date = "2017-07-14")
add_trade(type = "withdraw", withdraw_amount = 0.5, withdraw_currency = "XMR", remark = "lost wallet key")
See our first 5 transactions (rows) of trade history by running head(trade_history, 8)
      type deposit_amount deposit_currency withdraw_amount withdraw_currency exchange_name                remark       date
1  deposit            0.2              BTC             0.0              <NA>          <NA>     gift from brother 2017-07-01
2  deposit            5.0              XMR             0.0              <NA>      poloniex             purchased 2017-07-02
3  deposit            1.0              ETH             0.0              <NA>          <NA>         mining reward 2017-07-05
4  deposit          200.0            STEEM             0.0              <NA>          <NA>       Steemit rewarrd 2017-07-06
5    trade            1.1              ZEC             0.1               BTC          <NA> Exchanged BTC for ZEC 2017-07-09
Note that we don't need to supply values for all the arguments. Empty argument values default to NA. This, however, doesn't provide compact info about our portfolio. Let's create a function and name it portfolio() that will:
portfolio <- function() {
  deposit <- aggregate(trade_history[c("deposit_amount")],
                       by = trade_history[c("deposit_currency")], FUN=sum)
  names(deposit) <- c("currency", "deposit_amount")
  withdraw <- aggregate(trade_history[c("withdraw_amount")],
                                  by = trade_history[c("withdraw_currency")], FUN=sum)
  names(withdraw) <- c("currency", "withdraw_amount")
  portfolio <- full_join(x = deposit, y = withdraw, by = "currency")
  portfolio[is.na(portfolio)] <- 0
  portfolio$available <- portfolio$deposit_amount - portfolio$withdraw_amount
  assign(x = "portfolio", portfolio, envir = globalenv())
  print(portfolio)
}
Unlike add_trade(), this portfolio() function doesn't take any argument. Just issue portfolio() which in our case returns a compact table:
  currency deposit_amount withdraw_amount available
1      BTC            0.2             0.1       0.1
2      EOS           65.0             0.0      65.0
3      ETC            4.6             0.0       4.6
4      ETH            1.0             0.5       0.5
5    STEEM          200.0             0.0     200.0
6      XMR            5.0             2.5       2.5
7      ZEC            1.1             0.0       1.1
If were to know how much the portfolio is worth in, say, USD, EUR, CNY or BTC? Let's create a function portfolio_value() that will do our job:
portfolio_value <- function(priced_in) {
for(i in 1:nrow(portfolio)) {
url <- paste0("https://min-api.cryptocompare.com/data/price?fsym=", portfolio[i, 1], "&tsyms=", priced_in, collapse = "")
unit_price <- fromJSON(url)[[1]]
portfolio$value[i] <- unit_price * portfolio$available[i]
}
assign(x = "portfolio_value", portfolio, envir = globalenv())
print(portfolio_value)
print(paste("Total portfolio value in", priced_in, sum(portfolio_value$value)))
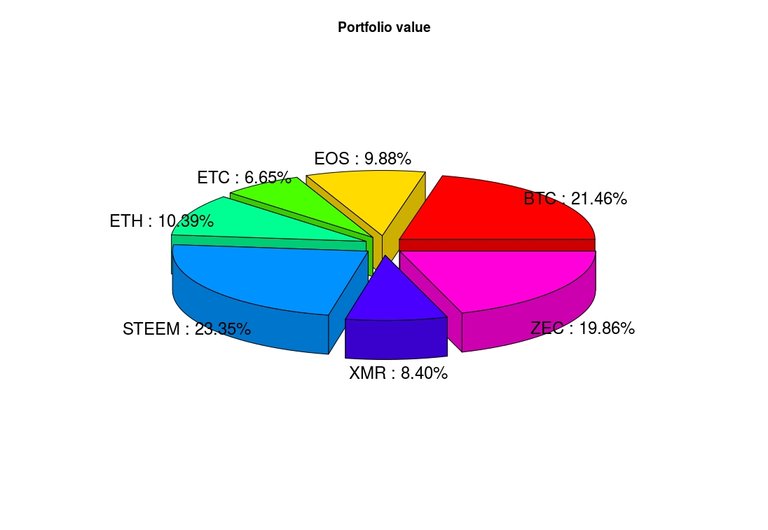
lbls <- paste0(portfolio$currency, " : ", # Create labels for plot
sprintf("%.2f", (portfolio$value / sum (portfolio$value))*100), "%")
pie3D(portfolio$value, labels = lbls,
explode=0.1, main="Portfolio value")
}
The portfolio_value() function takes one argument - the currency in which we want to evaluate our portfolio. Standard symbols are accepted like, USD, EUR, BTC, ETH. I would like to know how much it's worth in Chinese Yuan symbled CNY:
So I execute portfolio_value("CNY") which returns the below table as well as the pie chart:
  currency deposit_amount withdraw_amount available    value
1      BTC            0.2             0.1       0.1 1585.070
2      EOS           65.0             0.0      65.0  729.950
3      ETC            4.6             0.0       4.6  491.418
4      ETH            1.0             0.5       0.5  767.625
5    STEEM          200.0             0.0     200.0 1724.000
6      XMR            5.0             2.5       2.5  620.150
7      ZEC            1.1             0.0       1.1 1466.366
[1] "Total portfolio value in CNY 7384.579"
We might be interested in some predictive analysis of portfolio performance. Let's see how we can make prediction using simple method. I would like to know how BTC is going to perform in the next 30 days against USD. Let's create a function so we can do same thing for all currencies:
predict_currency <- function(currency, priced_in, period) {
  url <- paste0("https://min-api.cryptocompare.com/data/histoday?fsym=", currency, "&tsym=", priced_in, "&allData=true", collapse = "")
  histoday <- fromJSON(url)
  ts <- ts(histoday$Data$close, start = histoday$Data$time[1])
  fit_arima <- auto.arima(ts)
  autoplot(forecast(fit_arima, period))
}
Now run predict_currency("BTC", "USD", 30). It generates the below graph in which colored region indicates the likely price of BTC in USD in the next 30 days:
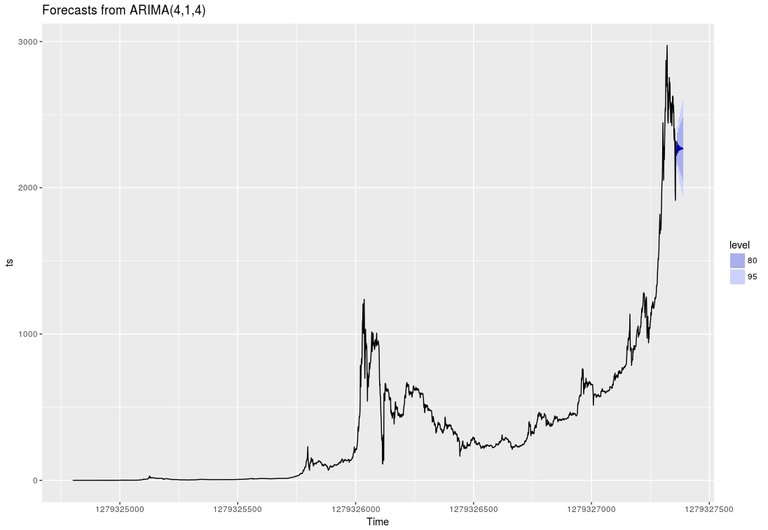
Run for, example, predict currency("ETH", "BTC", 7) to get estimated ETH price in BTC for the next 7 days. It would be nice to create a predictive function for our portfolio like:
predict_portfolio <- fuction (period) {
  # do things
}
We'll do this in the next post.
I just uploaded the script in my git repo. Feel free to contribute and provide suggestion to improve code so it can be actually be used by others. Thanks!
really nice work
Thanks! I'm going to work on creating a user friendly web interface so user can interact with data using mouse and browser only. There needs to be a lot more functionalities as well in order for the project to be practically useful. Hoping that's going to be something useful. Also, since R has powerful statistical analysis tools/packages, having structured data in R environment is a plus.
I've done hundreds of buys and sells across a number of tokens going back to late 2013 and have tracked everything to the penny with excel. It's such a pain!
Try
edit(trade_history)for an Excel like spreadsheet which lets you enter values in cells. You can import Excel files as well.This is definitely the quality of sharing I hoped to find on #steemit!
Much appreciated!
haha that meme
excelente aporte amigo, sigue adelante felicidades, sera un gran proyecto
This post received a 4.4% upvote from @randowhale thanks to @cryptovest! For more information, click here!
Hey gutted I have only seen this now tried to learn R a while back but needed some extra guidance . If you could get in contact that would be great would like to learn more about R .