3 month chart is looking a little like a double top, what do you think?

https://bitcointicker.co/stamp/btc/usd/3Mth/
Six month chart, what does this look like?

https://bitcointicker.co/stamp/btc/usd/6Mth/
Can we recognize any of these? Triple bottom, or inverse head and shoulders?

The 24hr chart looks similar to the 6 month chart pattern. Cup and handle?

https://bitcointicker.co/stamp/btc/usd/24hr/
BTC Market Cap Dominance is 58.3%, down from 58.53% 5 days ago.

1 Month Candles: $81,208 USD

https://www.tradingview.com/symbols/BTCUSD/
How low can BTC go in 2026?

https://www.coingecko.com/en/coins/bitcoin

$100 USD = 0.0012,3514 BTC
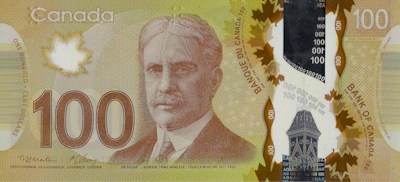
0.0008,8267 BTC = $100 CAD
Will you buy more BTC in September 2026?
This is not financial advice, just observations over time.
Do your own research!


Low? Lookin' like an October moon to me. 🚀
For me it doesn‘t look that bearish anymore. The 58k is more and more likely to have been the bottom. Yet the 82-83k is a heavy resistance. But we will go through as well as we did with the 67-68k. Posted about it yesterday, the market is running out of sellers.
Let’s go Bitcoin
Posted via HiveSuite