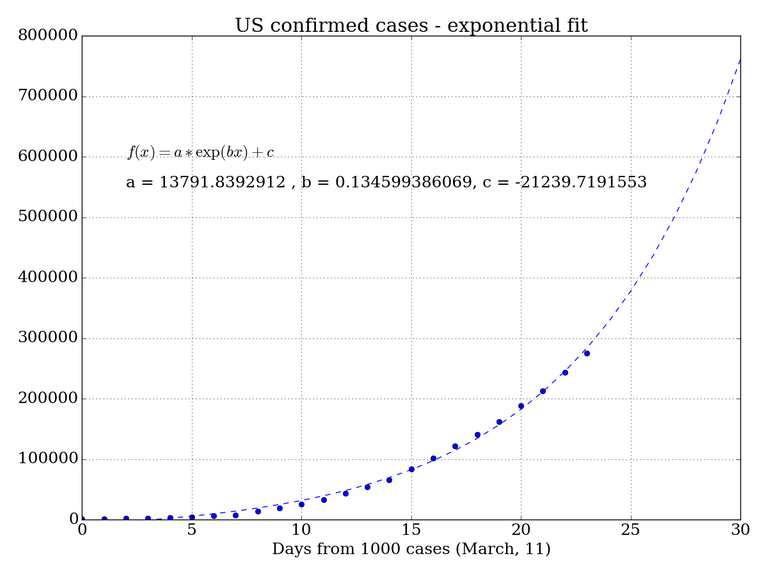
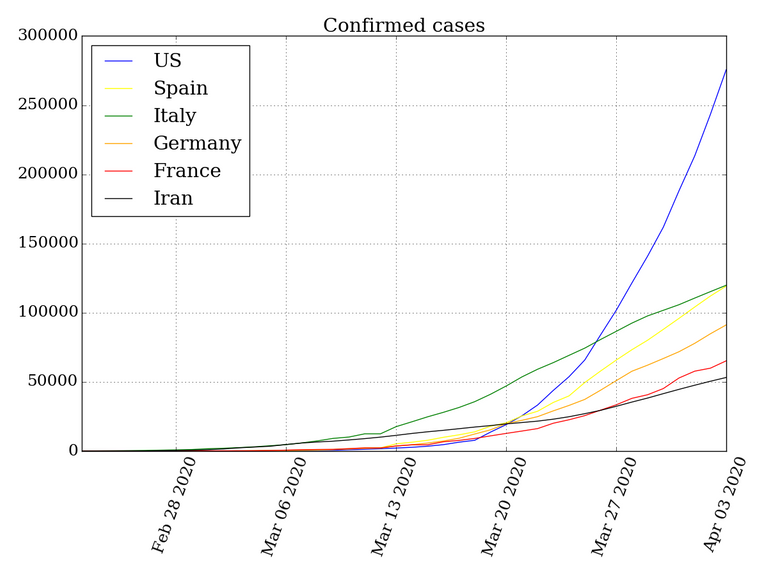
The CoV-19 epidemic in US still in progress. If the exponential trend will continue we will see more 700K case on next week. Let's hope that the trend will be broken and a rate will go down due to efficient virus counteractions.
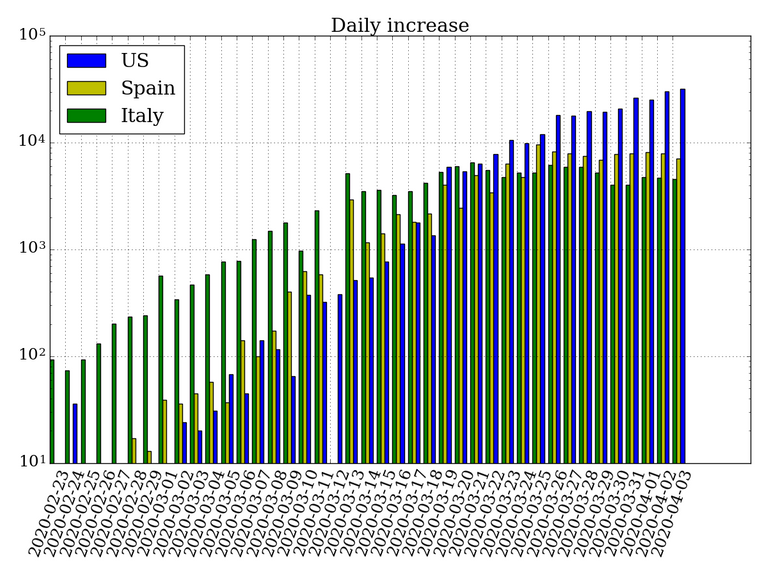
CoV-19 has started in Italy early than US and Spain, and already seems to not increasing a rate. On March 8, was expanded quarantine to whole Italy and after roughly 2 weeks was reached a peak rate. Now it looks like the epidemic stay on a plateau.
Infection in Spain started spreading later then Italy, but reached higher rate. Now it looks also reached a plateau.
Python code:
# Exponential fit
from scipy.optimize import curve_fit

def func(x, a, b, c):
    return a * np.exp(b * x) + c


US1000 = data["US"]["2020-03-11":]  # more then 1000 cases
xdata = np.arange(len(US1000))

popt, pcov = curve_fit(func, xdata, US1000)
print(popt, pcov)

plt.plot(xdata, US1000, "bo")
plt.plot(func(np.arange(len(US1000)+7), *popt), "b--")
plt.title("US confirmed cases - exponential fit")
plt.xlabel("Days from 1000 cases (March, 11)")
plt.ylim(0, 800000)
txt = "a = %s , b = %s, c = %s" % (popt[0], popt[1], popt[2])
plt.text(2, 600000, r'$f(x) = a * \exp(b x) + c$')
plt.text(2, 550000, txt)