Hello Hivers!
First of all, I want to point out that the following post is NOT financial advice or any kind of recomandation, nor am I lisenced to give one!
It is my personal opinion and view on the chart!
Today I was charting $QSP - Quantstamp chart.
Showing, weekly chart first so everyone see's where the price has been historically
https://www.tradingview.com/x/QTPS1IkN/
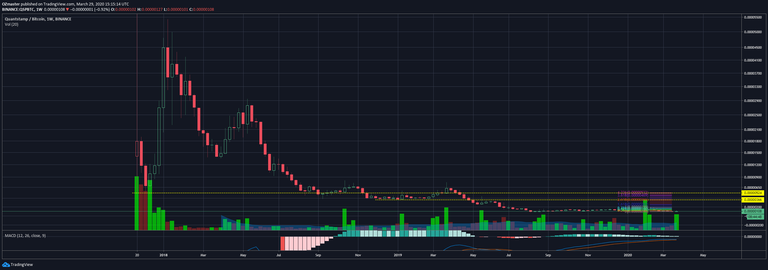
As you can see on the chart QSP started off trading at the very end of 2017 by going down from some 2000 satoshi to the ~500 satoshi range where it spent a few days before making a massive uptrend run and making an all time high at around 5500 satoshi in early Jan 2018.
Eversince it has been trading in a bear trend, marking a new all time low at 88 satoshi.
https://www.tradingview.com/x/x3qToHfs/
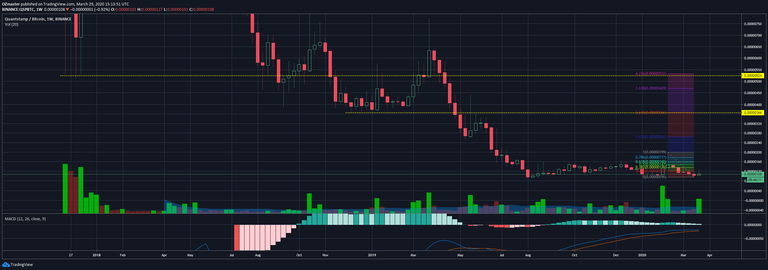
On this chart i will focuse on the lower levels, up to some 600 satoshi.
As one can see on the chart, whenever the price came close to the all time low price (around 90 satoshi) we saw a jump in buying volume, and therewith also a slight jump in the price.
Looking left at the chart we can see some support/resistance levels being used in the past, for example the ~500 satoshi area seems to have been a "turning" level in price already a cople of times.
Another area that stands out is the one around 350 satoshi, which served as a bottom for about 6 months in 2019.
https://www.tradingview.com/x/WOTKy9cj/
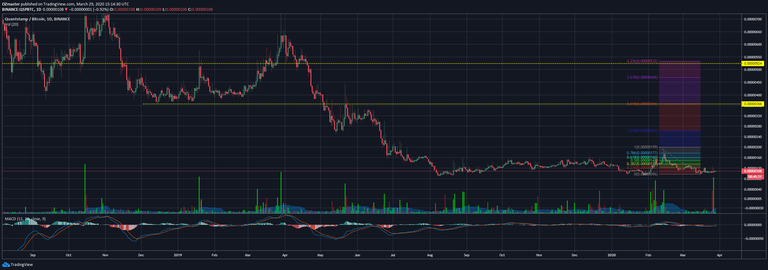
Pulling up a fib for the last price jump (from 90 to 200 satoshi) we can see that the 2.618 and the 4.236 aligne them selves very nicely with the previous support/resistance lines.
Another positive indication is the volume which again spiked once again just a few days ago.
All mentioned above makes, for me, the ~350 and ~525 satoshi good potential targets in a bullish case.
Please keep in mind, this is NOT financial advice or any kind of recomandation, nor am I lisenced to give one.
Enjoy your day and stay safe! :)
Kind regards, OZ