Hello Hivers!!
First of all, I want to point out that the following post is NOT financial advice or any kind of recomandation, nor am I lisenced to give one!
It is my personal opinion and view on the chart!
Today I'm analyzing $REN.
https://www.tradingview.com/x/bNfdYWIQ/
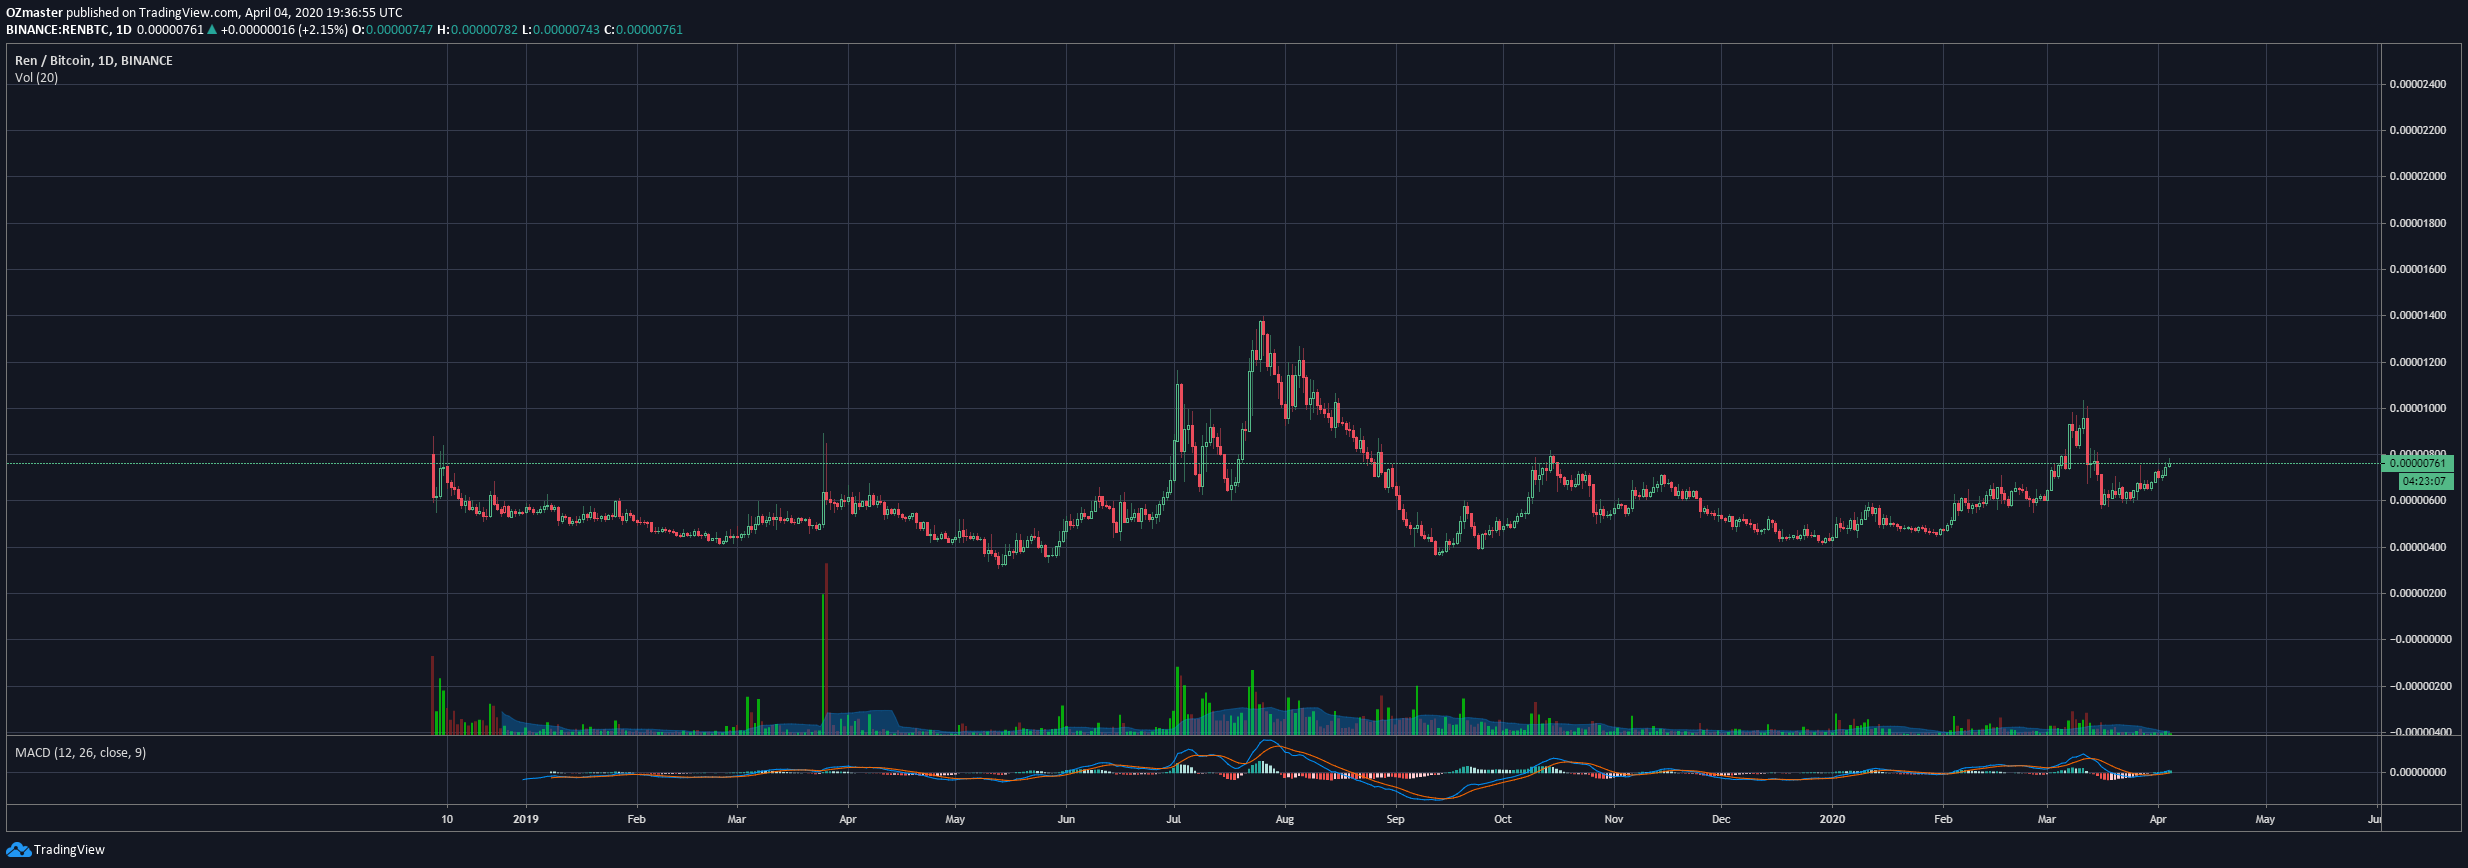
REN has a quite bit different chart compared to most cryptos out there.
Althou it made an all time low of 300 satoshi in early 2019,
unlike most other, REN also made an all time high at ~1400 satoshi in July last year.
After marking the new all time high, the price did make a hard turn downwards and retraced all the way down to 360 satoshi.
Since the price has been trading in a range from 400 to 700 satoshi mostly.
As 2020 begun, we saw a little increase in the volume and overall trend in the chart turning slightly more bullish.
This resulted in a local high of 1050 satoshi just 4 weeks ago.
For $REN im looking at a longer term targer, an new all time high one, but will try to point out some levels which I see being interesting price points along the way. (well,, might turn out short term, never know in crypto)
https://www.tradingview.com/x/WLvMXEjL/
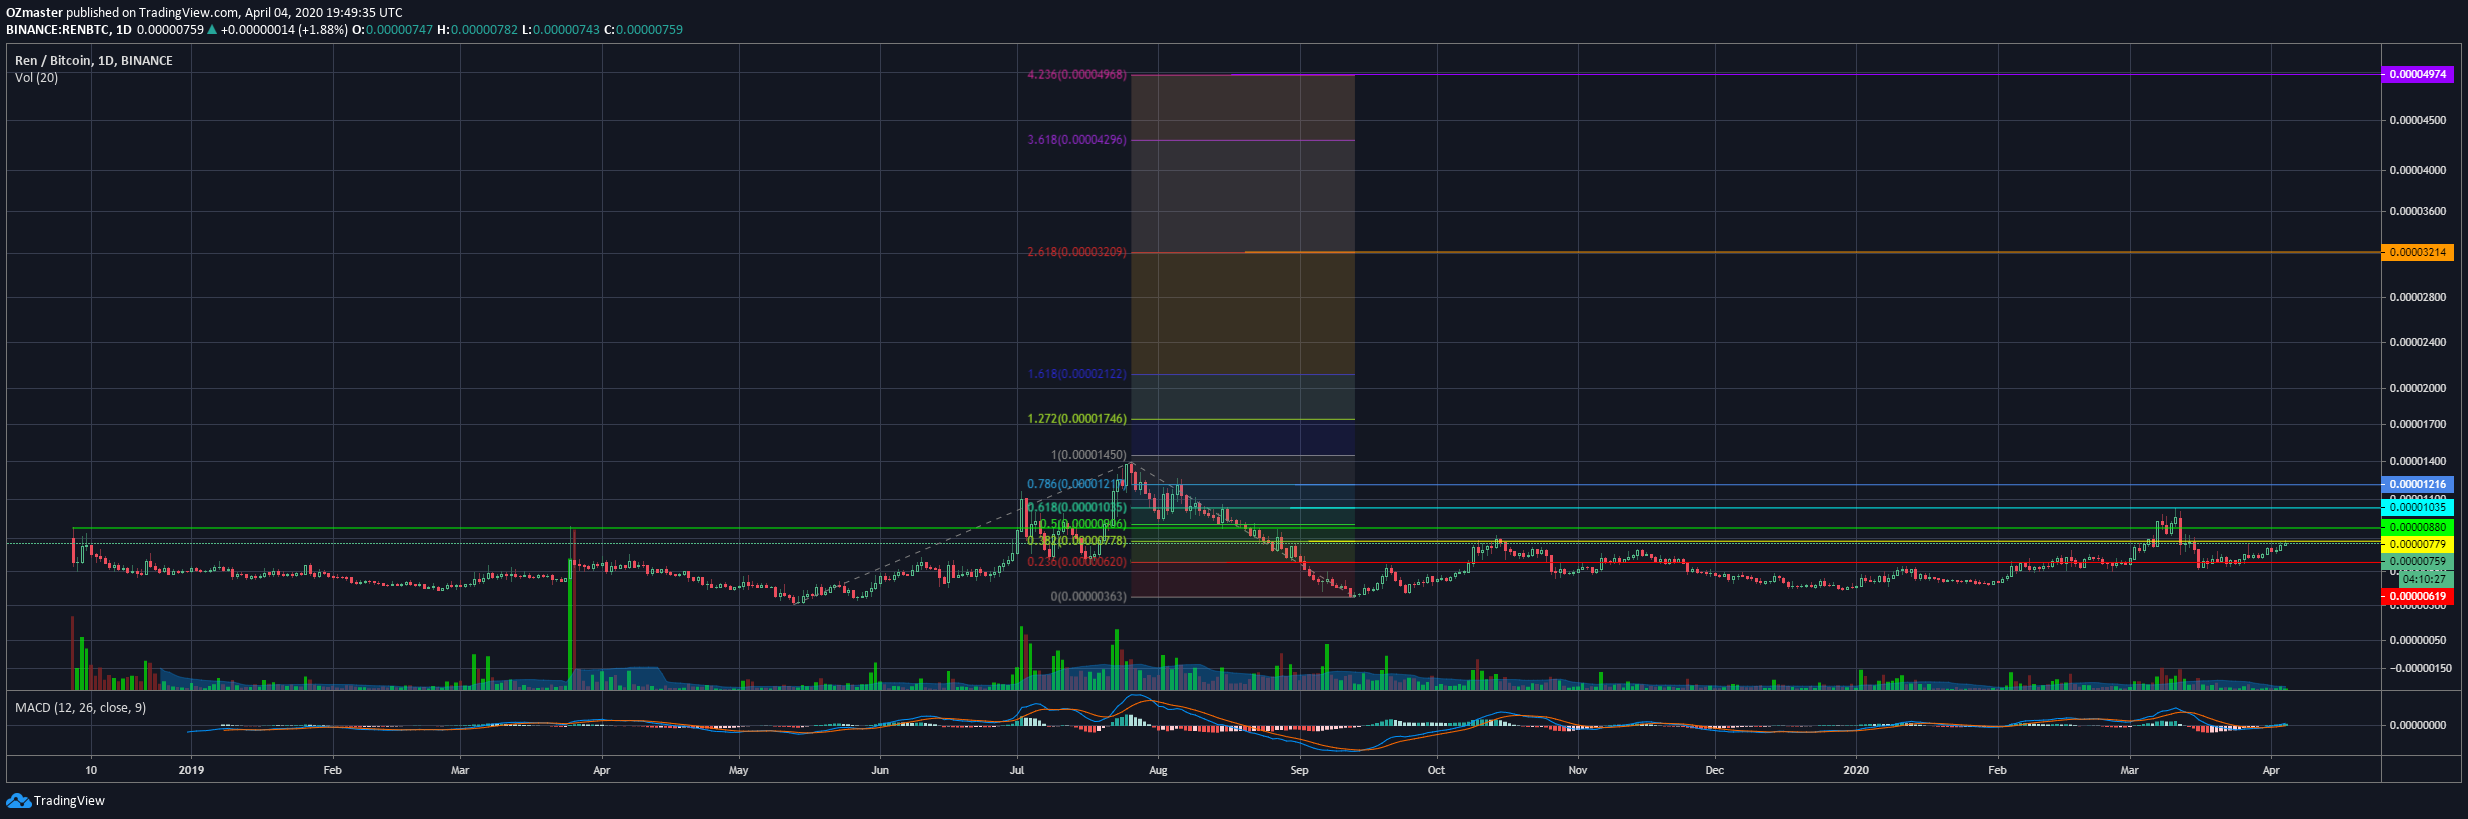
Pulled up a trend based fib extension which gave me some interesting levels to watch.
The fist thing i notice is that the 0.5 fib line ( green one) price of 906 seems to have been used as resistance from the very start of the chart.
Another observation is that the price action since the local bottom of 360 satoshi, seems to be using the fib lines as resistance/support levels, in some cases (like the recent runup and today's bounce- check 4h chart to see better) hitting the lines almost perfectly.
Now to my potential targets and how i aproximetly see this playing out.
https://www.tradingview.com/x/aBsz6lZs/
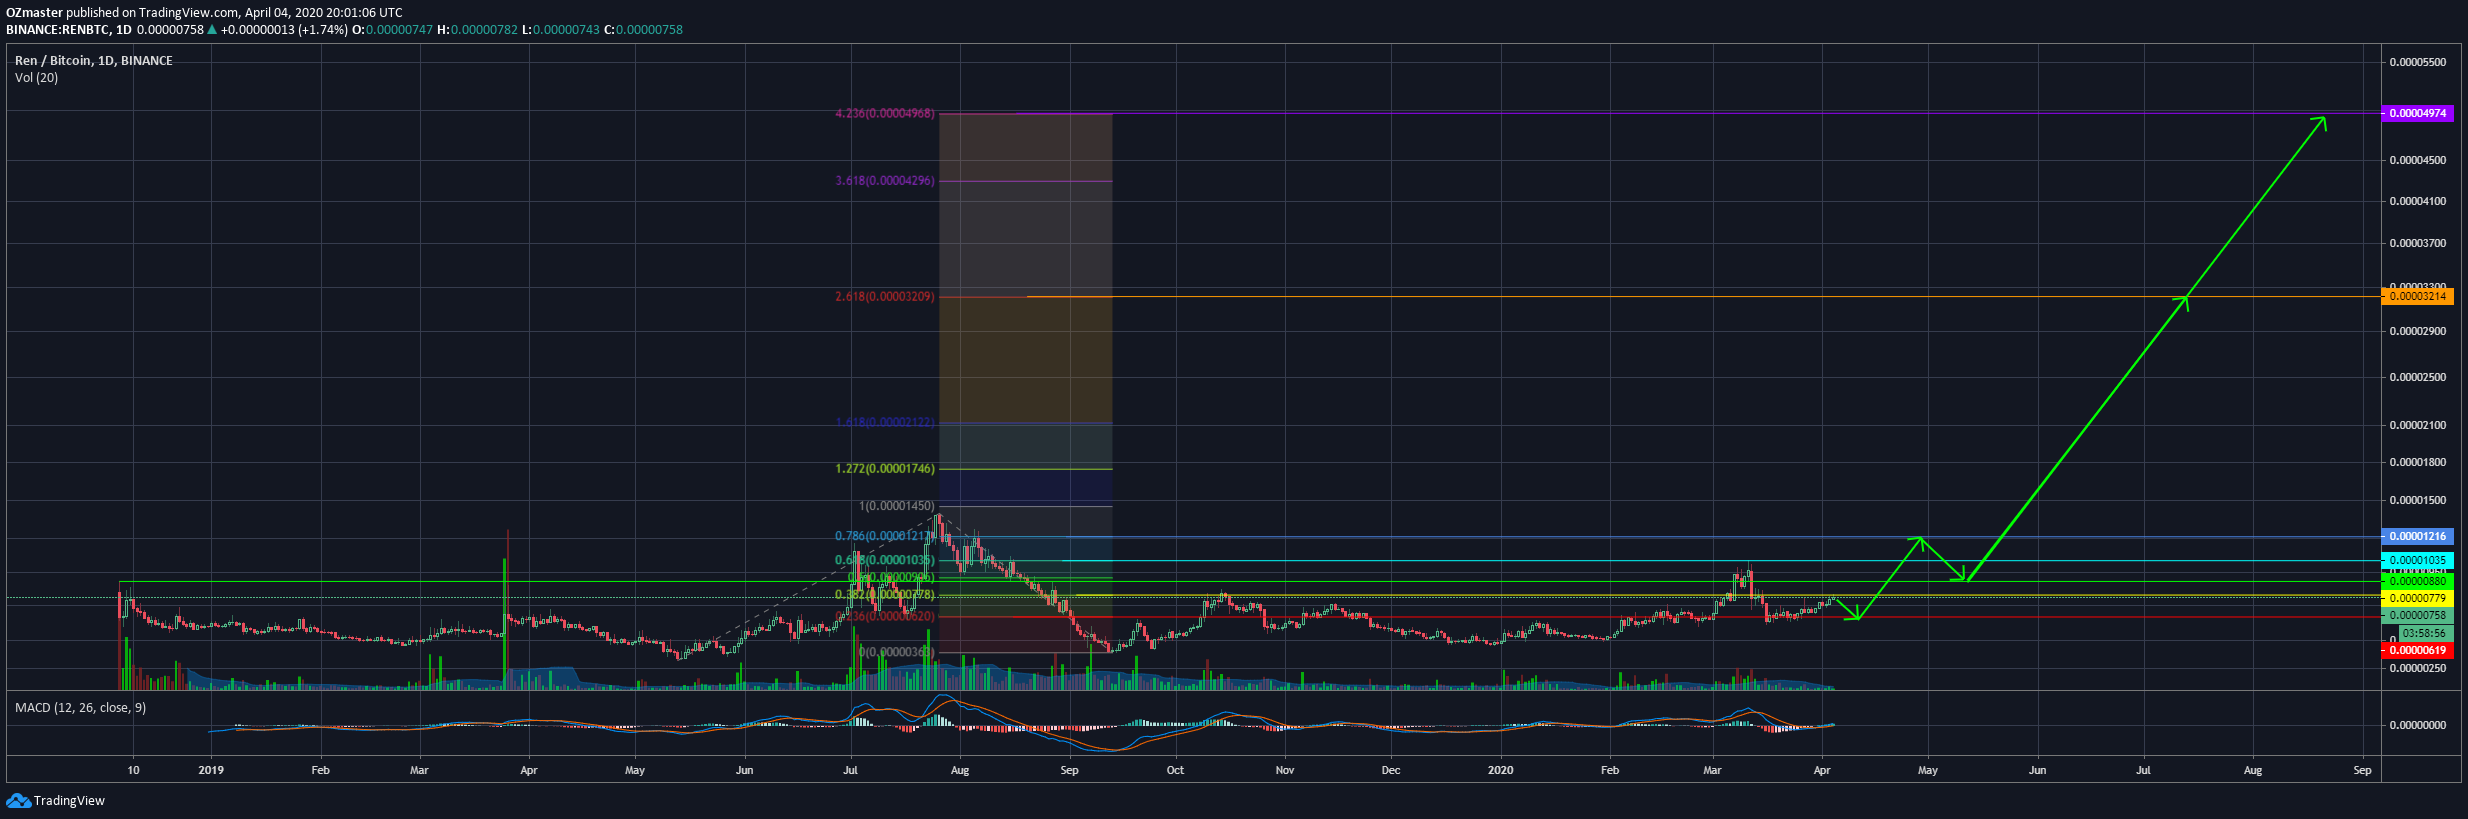
My final potential targets for $REN would be ~3200 and ~5000 satoshi, the 2.618 and 4.236 fiblines.
Of course I don't expect a straight run up towards those prices but rather a slow to medium colatile growth, strenghtening towards the peak.
For a little bit shorter term expectations,
depending on how this week plays out, I see the price first dropping to 600-620 satoshi (to the 0.236 fibline), or it continuing it's path upwards. The first target on the upside for me would be ~1200 satoshi, given that it is the 0.786 fibline but also what i like to call "bottom of the top" (basicly the bottom side of a top, not sure if that makes linguistical sense, but I think u'll understand if you look at the chart).
Now I talked about the 0.5 fib line, the 900 satoshi level and how it has been used in the past as resistance. This time thou I expect it to be used rather as a new support then resistance, in other words, if the price hits 1200 satoshi and start turning, I see the 900 satoshi area being the big support level from which I expect to see price continuing it's upward movement towards my final potential targets.
Please keep in mind, this is NOT financial advice or any kind of recomandation, nor am I lisenced to give one.
Enjoy your day and stay safe! :)
Kind regards, OZ