HOW TO CALCULATE AVERAGE CLIENT VALUE. AND USE IT TO DETECT PROFITABLE LEADS.
Hello, in this article I’ll show you how to calculate average client life value and how it is related with the Profit Detector Formula.
More about the Profit Detector Formula you can read here –> Profit Detector FormulaIn order to find the most profitable part of the clients you should not only remember this numbers but also build a strong concept of how they will affect the deal.
For that purpose, we need some data from a few clients.
I have selected 4 google adwords clients, some of them we are still working with.
The graphs you see in the left side represent the money they spend on the service on monthly basis in the vertical.And the time period in horizontaly.
The pics you see are moments of promotions or special offers we need to put additional work on their projects.
In the right side you can see the niche of the client.We have Climbing Walls Producer, Clothes Ecommerce, Tourism Agency and Online Supermarket.
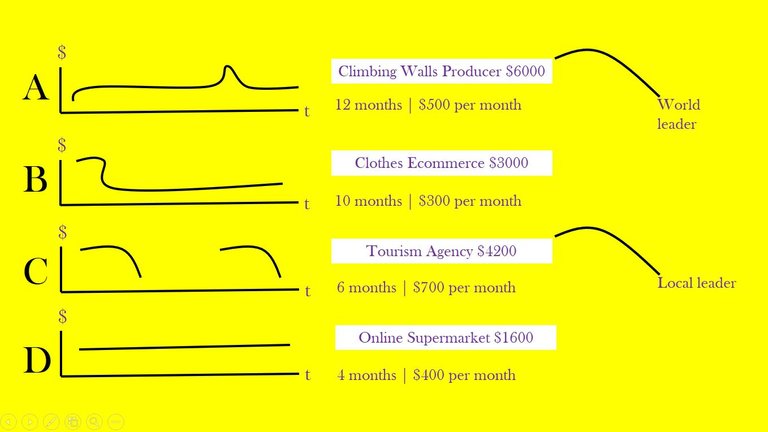
You can see the data for each client underneath.
The Climbing Walls Producer has a total time of 12 month and average 500$ per month.
The average monthly price for each company is calculated as sum of the all monthly fees for that company divided by the numbers of months they receive the google adwords service.
The total profit from this client is 6000$ dollars.
Which comes from 12 multiplied by 500, which are the months for that particular client by the average monthly price.
Clothes Ecommerce client has a total time of 10 month and average 300$ per month.
Tourism Agency client has a total time of 6 month and average 700$ per month.
Online Supermarket client has a total time of 4 month and average 400$ per month.
You can see that the graph for the tourism agency has an interruption space.
The reason is that they have seasonality and for the rest of the time stops google adwords and invest in other services.Here we should note that the averages are also niche related.
So if you have 10 tourism agencies the data will be much more correct for that specific niche.But rarely you could have such a data, otherwise we are calculating service averages rather niches averages.
Now I’ll show you the formula for average Client life period.It is sum of all the time periods of the clients divided by the number of the clients.
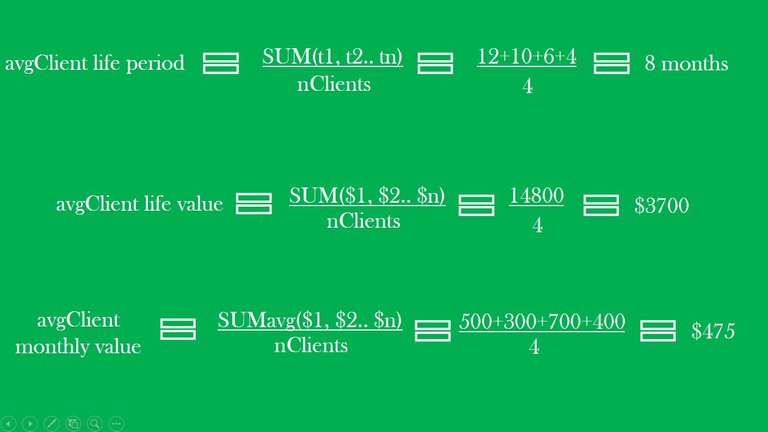
In our case, we got an 8 months average Client life period as a result.If you want to calculate avgClient life value, you should sum all the client total values and divide them by the number of the clients.
In our case we receive 3700$ as a final value.
And last, if you want to calculate the average Client monthly value, you should sum all profit averages by each client and divide by the number of the clients.
The result on basis of our data is 475$.
If you don’t have your own data, may find some statistics in the internet to get a clue of the averages in your sector.
When you calculate the niche and service averages for your company you can keep this numbers in mind and they will help you in defining the most profitable part of your clients.
This is what exactly the profit detector does.Now I am going to show you this exact part of the process.

In the left you can see one of the graphs.
It is for tourism agency and the point above is the Average client monthly value and time period we just calculate.
The main idea you should keep in mind here is the purpose of those averages.
They gave us a point to define whether the client will pass over the average time period or will drop out earlier.
The best way to answer this question is based on the client satisfaction from our services.In our case google adwords.
The most related condition to client satisfaction in google adwords is the positive ROI.
But how to determine the chances for positive ROI before closing the deal and even before start negotiating with the client?
In profit detector formula we create a simple relation between quality of the services of the client and their investment capabilities.
When the client has a quality services and enough money to receive critical amount of visitor to his website it is more likely to reach positive ROI values.
On the graph in the right you can see that relation.In vertical we have the quality and in horizontal we have the investment capabilities.
In the middle of the graph we have the critical point.
From quality perspective, above the critical point we have a client with high level of services.
And below that point we have equal or lower quality of the services compare with other companies in the niche.
From investment capabilities perspective, the left from the critical point means the client have no or just a little budget, and right from the critical point means the client has plenty of budget.
You could easily define the quality of the services with a small search before contact the client.
Let say we have the tourism agency from the left graph.
You need just to open their website and observe the tourism packages they offer.Let say we noticed they offer mostly vacations in Greece.
Than we got some orientation about their prices and terms they are offering.
The level of the hotels, even the quality of the pictures and other features of the website.After this you need to make a simple google search for similar companies, that offers vacations in Greece and to compare their services with that particular client.
Let say in this example the quality of the services is pretty high and the client has tangible advantage to the competitors.
This means this client is above the critical point on the graph.The next task is to determine the investment capabilities of the client.
The easiest way to get this information is to make the first contact with the client and to ask them what they intend to invest in the campaign.
For the given example, let say the client has plenty of budget, which place him to the right side of the critical point.
This means this client is positioned in the upper right corner of the graph where we see a big YES.
This means that this client is more likely to receive higher ROI and therefor to cross over the average for the service.If the client is in the down right corner, we got a smaller yes.
This is because even the client has a budget his services are equal or less quality compared to the other companies’ services.
This lower the chances of positive ROI, but still we consider that this client has a good potential to cross the average time period for the service because he will still receive his market share based on his budget and service level.
In the down left corner, we have a client with low quality services and small budget.This gave us big NO.
This client will not receive positive ROI and it is more likely to him to not be satisfied from the result of the campaign.
Therefore, he will drop out earlier than the average of the service.
In the upper left corner, we have question mark.This is because we have a client with higher level of quality of the services but small budget.
The good services help for positive ROI but the smaller budget may not deliver enough visitors to his website.
That’s why we are not completely sure of the result here.The best prediction is to place this client on the average point.
The easiest way to remember this approach is by two simple questions.
Do they have money?
And
Do they have future?
The first question responds to the investment capabilities.And the second one to the quality of the products or services.
Both this questions leads you to the prediction if the client will pass the average for the service or he will drop out earlier.Which is exactly the first part of the profit detector formula.
In the next lecture I’ll show you how to extend the formula with the non-monetary factors and by the relation decision-competency.
You will also learn what is momentum and how to apply it in the profit detector sales formula.Now you can get the Profit Detector Sales Course with 80% discount!