Hi there! I'm back with a biology - statistics post. In sciences, statistic is a very important tool which allows us to find answers to all of the questions we propose, and get a full understanding of what's going on around us. It's scary, I'm not gonna lie to you, but it gets easier with the practice. Today, I'm gonna share a piece of homework I've been working on these last couple of days for this course named Data Analysis I'm following. More than statistics, this is a graphing exercise.
The main issue with this homework is this: in his 1977 book "The Dragons of Eden", Carl Sagan showed this image to illustrate the relationship between two types of variables: body mass and brain mass. His intention was to show how this relationship can be traduced as some kind of intelligence index, in which modern human stands out as the most intelligent creature.
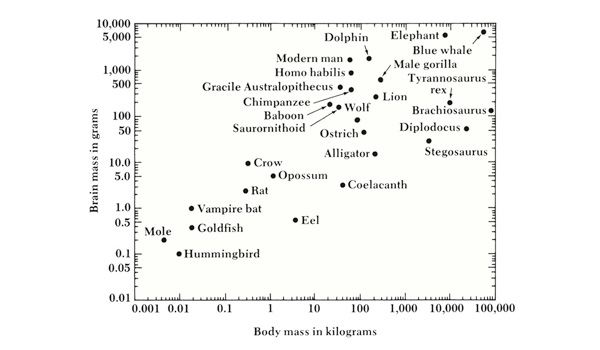
But there's a problem. This relationship isn't quite evident, and the superiority of human inteligence isn't very visible. This can be caused by a non-representative disposition of the data. So, the goal was to find a way to improve the representation of both variables with the same data :-) Now, I'm gonna show you how I did it, and you gonna tell me how wrong I am. I used R Studio for this, and I'm posting the R codes I used so you can check them out.
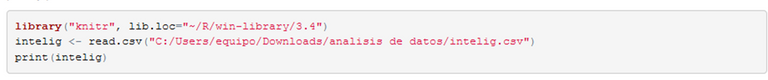
First, data was extracted from graphic above with software Web Plot Digitizer (available in https://apps.automeris.io/wpd/). Then, the used packages were selected and matrix generated from extracted data was loaded. Command "print" to view data, and command "str" to check structure of the data.
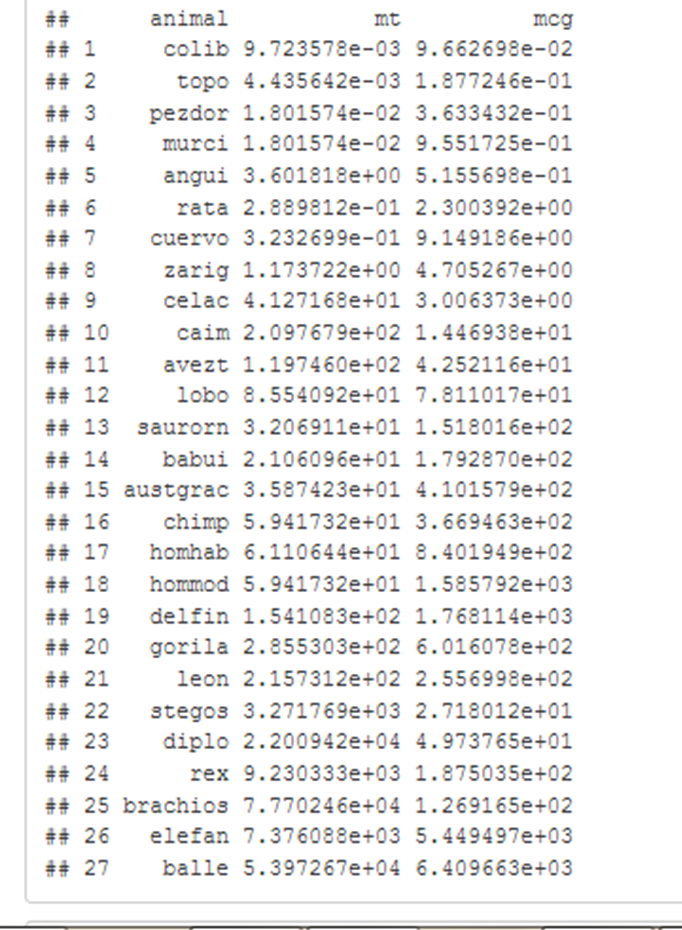
(The names of the animals are abbreviated in spanish.)
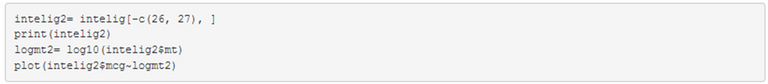
So, we have matrix with 27 observations, two quantitative variables (mt means total mass in Kg, mcg means cerebral mass in grams), and one factor named "animal" with 27 levels. Due to the great variability of the animals in body mass, I made a plot on a semi-logarithmic scale, transforming total mass (mt)into based 10 logarithm.

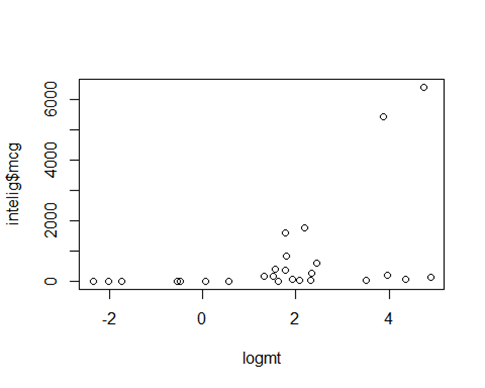
In this graphic we can see two point, corresponding to factor "balle" y "elefan" (blue whale and elephant, respectively) that can be considerated as "outliers", because the big size of these animals can difficult the appreciation of the relationship between the two variables in the rest of animals. A seccond matrix without these two "outliers" was generated, and a seccond plot was launched.
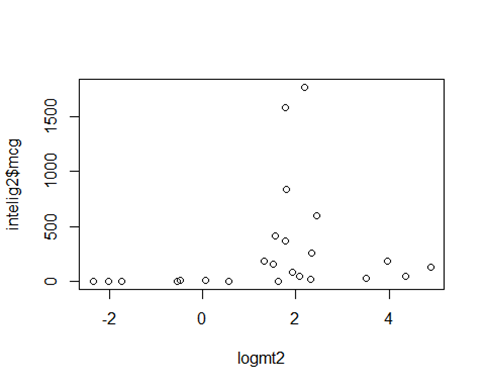
This time we can see clearly the highest points, corresponding to modern human and dolphin, animal whose intelligence has been demonstrated.
In order to see this relationship more clearly, we can use the encephalization quotient formula to get the value of the cephalization factor for each animal (https://es.wikipedia.org/wiki/Cociente_de_encefalizaci%C3%B3n#C%C3%A1lculo). The formula is:
brainmass = c(bodymass)^2/3
where c mean cephalization factor. Clearing c, we can calculate the c valor for all of the 27 factors in original matrix, we're not ignoring factors this time. First of all, we need to convert the units of the brain mass from grams to Kg, and then we proceed to calculate c:
c = brainmass/(bodymass^2/3)
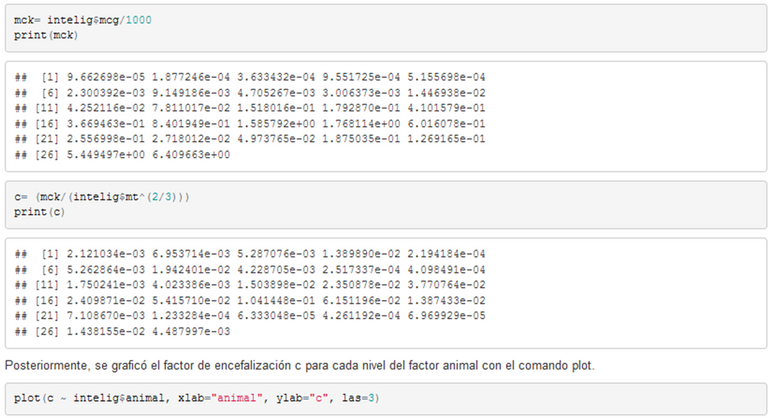
Then, a plot c vs factors was made.

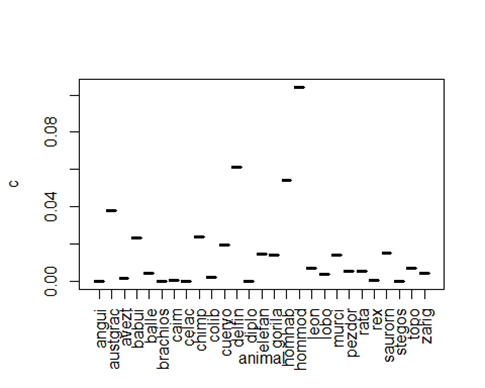
In this way, is easier to show the encephalization quotient interpreted as a body mass- brain mass relationship whose is indicative of intelligence, and it's better expressed what Sagan meant in his book about the smartest animals (modern human in first position). According the same author, the evolution of mammals from reptiles came with an important increment of relative size of the brain and intelligence, and evolution of humans from simple forms of primates impulsed an impressive process of cerebral development.
References:
Sagan, C. 1977. Los dragones del Edén. Especulaciones sobre la evolución de la inteligencia humana. Edición especial para Editorial Televisa. S.A. de C.V., 2003. Disponible en: [http://prof.usb.ve/rescal/Los%20Dragones%20del%20Eden.pdf].