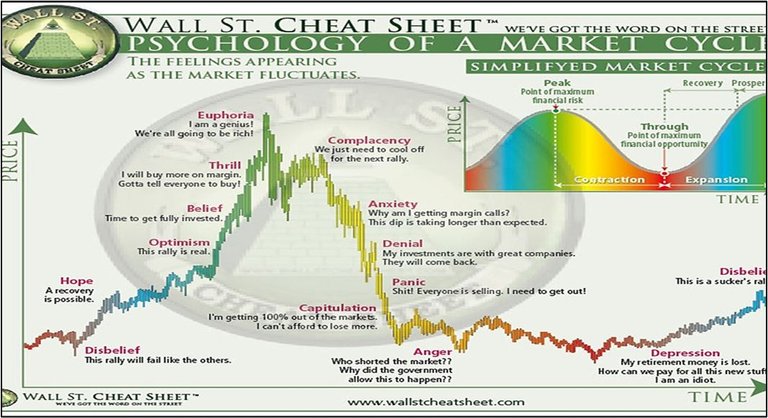
So where are we in the emotional chart?
The emotions I've seen on a daily basis for months now are nothing but 'anxiety' and 'panic', with some sprinkles of 'belief' for the bulls who remain convinced that Q4 is going to be a fantastic quarter. Clearly I'm one of those bulls, but also the current price action remains bothersome.
lol really?
Imagine just slapping emotions onto the peaks and calling it good. Most people who try to use the Wall Street psychology chart find themselves completely out of touch with reality. You have to be in the trenches to know the emotions of the plebs. To pretend like we've been in a collective euphoric state for the past four months is beyond absurd. We never even made it to Thrill. We definitely made it to belief though. $100k crab feels like the "I need to get fully invested" moment.
And also... look at this guy's timeline. Those are monthly candles. That's a multiple-year timeline. Is he expecting the bear market to last 6+ years? That's what his own chart is implying. Totally absurd analysis.
Fear engagement strong
Funny because the literal definition of a Black Swan is an UNPREDICTABLE event that catches everyone by surprise. This guy is not Michael Burry in the Big Short. This guy doesn't know anything and is engagement farming the obvious fear people are feeling right now.
"YOU WON'T BELIEVE IT IF I TOLD YOU"???
lol. shut up.
Even dumbass Andrew Tate is jumping on the engagement train. Makes sense considering this is kind of his thing. Bitcoin to $26k? Really? That's like when everyone said in 2022 that Saylor was going to get liquidated at $4k BTC.
Another very important thing to note here is that if we even return to $58k... which is only -54% away from the current top... this would completely invalidate the four year cycle. I see a lot of plebs out there parroting the same paradox:
I believe in the 4 year cycle which is why I think we're going back to $58k.
Except a big part of the 4 year cycle is that you don't get the same price 3 cycles in a row. That completely invalidates the four year cycle. $58k was a huge resistance trendline in 2021. $58k was a huge support trendline in 2024. We did $58k. It's over. Going back to it means you can no longer subscribe to 4-year cycle theory. Pick a lane.
Again... totally irrational takes
Coinbase does not sell BTC.
Binance does not sell BTC.
Blackrock does not sell BTC.
These are custodians.
People are selling BTC, and we have no idea where that money is going.
A lot of it could be going right back into BTC for all we know.
Tongue in cheek
The thing that gets me is that everyone knows "sell in May and go away". Price of BTC in May was $95k. Bottom of Q3 in September was around $108k. Current price today is $105k. This is all a very tight range and is nothing to be freaking out about. Just further evidence that the entire world is drowning in scarcity, greed, and fear.

Gold murdering it.
Gold has been on an absolute tear for 18 months straight. Peter Schiff is loving it. I think I heard that it's gone from a $12T market cap to $30T. Pretty impressive stuff, but also quite alarming. Gold going up often signals that extreme fuckery is going on and the rich are hunkering down on safe haven assets. Many in Bitcoin are hoping for gold to level off and a rotation into BTC to occur, but it's unclear if such things can happen; this is totally uncharted territory.
Interesting to label gold as a "sovereign short squeeze". I can't say that I disagree. Ever since gold got divorced from paper money we've seen how these things play out. When governments print too much money and become untrustworthy, gold tends to be the go-to. Clearly, gold going up is some kind of major signal that will become far more obvious in hindsight.
way outside of the bottom band
By this guy's own analysis we were even farther outside the top band two weeks ago. Isn't that a signal that the price will travel the opposite way according to how Bollinger Bands work? I seriously don't understand how these people operate.
1) What
99% of the time this price would reverse but fuck it I'm going to bet on that 1%
I haven't been following this guy for super long so I'm not sure if he's just a perma-bull, a contrarian trader, or just following the four-year cycle. Personally I'm not worried until Bitcoin is trading in the $100k-$103k range for a couple of days. That's supposed to be the low leverage area that we should recovery from quickly. Not recovering quickly in that small range is a bad sign... and we are getting very close to that range.
I've seen this one circulating around a lot as well.
Apparently the 2017 bottom to top matched the 2021 bottom to top down to the day.
And one everyone is worried that it will somehow happen again this cycle.
It feels weird to remind everyone that this is not how it works.
You can't time the top down to the literal day.
The fact that 2017 and 2021 were insanely similar is a fluke.
And also this nonsense didn't start circulating until AFTER October 6th.
Not before.

Classic survivorship bias
If you wait for crazy coincidences to happen in retrospect...
You're always going to find them no matter how improbable they might seem.
For every correct prediction that gets attention there are thousands of ignored failures.

My analysis
This is the first time I've felt the sting on the Bitcoin chart recently. Price is trading below the MA(200) right now, which is not ideal. I want to see candles inside the moving averages to create a stable narrowing platform in which to springboard higher (common theme for BTC).
It's obvious at this point that the Trump Dump of October 10th did not really affect the price of BTC at all. As I've stated before time and time again: news does not move the price; news only catalyzes the price. Bitcoin crashed like it did because it wanted to crash, and it was just waiting for a reason.
This has been further confirmed by the more recent price action. We've been red 4 days in a row and almost back to the bottom of the Oct 10th candle... even though all the leverage was flushed on Oct 10th. Again, that's not a good sign, but as long as we aren't grinding in the $100k-$103k range it's not the worst thing ever.
Put up or shut up
I am down $700 on a BTC long that I still have open. Normally I would be freaking out about this. Any loss of $500 or more for me when it comes to my gambling is a big deal. This will normally send me into a tailspin of me constantly checking the price and hoping my luck will turn around. That's not how I'm feeling right now.
In fact I just added more to my long today. If Bitcoin crashes a little below $95k at this point I'm going to lose around $2000 on this bet, and I'm actually fine with that. Q4 of the bull market year only comes around once every four years (never again if the cycle is broken). If I lose big here I've made my peace with it. Let it ride till late November imo.

Bitcoin Dominance
Things were looking really good for a while there on the dominance chart, but then we got this bounce and the opposite of an alt market. Obviously dominance isn't continuing to make new all time highs like it was for multiple years in a row, but it is maintaining that key ~58%-60% level. My "take the stairs up and elevator down" analysis is losing it's relevancy as BTC.D continues to crab like this. Hopefully we see a turnaround by the end of the key month November.

https://www.coinglass.com/today
Here's another big reason why I'm willing to lose so much on this bet. If we look at the entire year of 2025, it's all been relatively unremarkable. Both 2023 and 2024 were exponentially better than 2025, while still not feeling like a bubble. 2025 has lagged for the entire year with mostly tight-ranged crab action. We started the year at $100k, dipped down right below the liquidity void at $77k, pumped up to $112k, and now we continue crabbing within a 10% range of $112k since the end of May this year. All in all we haven't done much, but the voices have been very loud.
But more importantly, if we look at the month of October... it's green every single year except the 2014 and 2018 bear market years. Even in 2018 it was only down 4%. Today we are down 7% in a bull market year, which is either a signal that something is terribly wrong... or just yet another crazy buying/gambling opportunity. Personally, I'm willing to make the gamble. Honestly I was kind of expecting to be up 30% this month, but at this point I'd settle for +10% as a huge win. We started October at $114k so we'd need to end at $125k to get that 10% locked in (so basically back to all time highs). I'm endlessly curious to see if we make it.
Emergent downtrend?
Even though we've been red four days in a row and people are losing their minds, there still isn't any downtrend to speak of. It's pretty difficult to find a downtrend without a decent bounce, and the last bounce we got was so steep it's not really helpful for calculating a downtrend (unless we actually are in freefall mode and don't even realize it yet). We need to wait for a dead bounce to occur to confirm any kind of downtrend, and even that will be an unsubstantiated guess. Two dead bounces would be enough and highly alarming. Of course if the bounce is not dead and goes higher than $115k there was never any downtrend to begin with.
Death-cross today
Technically there was a major death cross today between the MA(25) and MA(100) default daily moving averages. However, these two lines have been hugging each other close for 5 or 6 weeks in a row, which I'm fairly certain is some kind of huge record-breaking moment for BTC. I was talking about this weeks ago. Never seen anything like it, and it's still going... somehow.
Ideally bears have overtraded this death-cross and are not about to get wrecked, but we'll see. Again, the key support area with very little leverage is $100k-$103k. So at least a dead bounce from there should be expected in the short term even in many bearish scenarios.

6 month heatmap
As we can see the Trump Dump on the 10th completely wiped out most of the leverage on the chart. There isn't a lot of leverage on either side to be honest. The sharks have been cleaning house with this volatility, and it's not even very volatile. So basically it's just degenerates using absurd leverage higher than 10x. Maybe don't do that. A 5x at current market price gives a liquidation -20% @ $85k. That's a much more reasonable bet to be making at this juncture. Hell at this price even a 10x gets you well under $100k.
Conclusion
Uptober is off to a very rocky start, but that's also what happened last year and the year before. Is this yet another obvious opportunity, or just another trap for the bulls? Personally I'm still bullish until the fat lady sings and I lose my $2000.
UPtober was a big liar this year, haha!
Monthly candle currently down 5%.
Most of October's gains come in right at the end of the month.
Will be funny if we end up green after all this fussing.
Can't wait to be surprised by some plot-twist here, haha!
Number going up when everyone is calling the top has never been a plot-twist 🤑
Buying high and selling low is the standard.
The real plot twist would be the bear market actually starting now.
Isn't ETH growth over ATH supposed to trigger altseason, at least a minor one? What's wrong with ETH, any hope it will surge?
I have heard that a lot of the alt-market depends on ETH performing.
Not sure if true but the logic makes sense.
I really have no idea what's up with that.
Maybe there's a lot of demand/supply over-the-counter before those people try to pump spot.
Unclear, which is why I tend exclusively predict Bitcoin because it's easier to guess the direction.
Gold has gone into a parabolic phase and I think that trade is almost played out. I sold last of my gold miners ETF yesterday...
I've seen a couple people point out that the party has to end sooner or later.
Here's to hoping the trade works out for you.
I think you have a good chance.
Not the start to Uptober we expected. Everyone expects a super Q4, we cant all be right? can we?
That's the weird thing I feel like it should be totally expected because this same type of thing happened in 2024 and 2023 to a lesser extent. It's like people have the memory of a goldfish. No one's satisfied unless it's only-up.
I'm just riding this struggle bus all the way to wherever it is heading...
What if the real plot twist is that the real market makers, the banksters, are changing what money is, and number is just a distraction from that fundamental alteration? The global push for digital ID is a fundamental alteration in how money works, because the data harvesting surveillance that has been implemented enables granular imposition of restrictions on the utility of every money a particular individual can use in order to control their carbon footprint, as has been publicly discussed in WEF and similar venues throughout the Covid reset.
Whether you have $1M BTC or $10k gold is immaterial if you can't buy a $50 hamburger because of the lack of bugs in your diet in the last month, IOW. Neither BTC nor gold become more valuable when their prices go up. What is actually happening is that the value of dollars is plunging. This is just inflation in action. From that perspective, your long bet is likely to pay off, but that won't mean you have more wealth because in actuality the dollar metric is plunging in value. There's no new uses for gold. It's value is stable, like the rock it is.
What matters is the ability of money to be exchanged for goods and services, and that is rapidly and globally being radically altered by digital ID empowered by the TIA data harvesting that has been fully realized in the last decade. When confronted about his private jet travel and his carbon footprint, Bill Gates pointed out that he offset his exorbitant carbon expenditures by investing in carbon sinks. That seems to be the real metric the banksters are imposing as 'money' going forward.
You're a gambler. You enjoy watching the players play their hands and beating them by understanding why they play the way they do. I hope to encourage you to watch the real play and players to whom these charts are just bait for the retail markets. If you can take a few pots at that table, then your 'money' will be maximally fungible, actually able to be exchanged for the goods or services you want without restriction.
There's clearly a reason seventeen jurisdictions implemented digital ID in the three months prior to Uptober, and Vietnam froze 86M accounts for not complying with digital ID requirements. Digital ID enables using TIA to impose restrictions on money via the carbon metric of choice of the real market makers. This is a fundamental alteration of money and markets ongoing that will translate into actual purchasing power. I have put my 'money' where my mouth is, building an aquaponics greenhouse this last summer that I hope to have in production by this spring, to sidestep restrictions on money because of carbon/social credit and enable me to secure protein from sources besides crickets and mealworms.
However, there are financial instruments that will offset the credit restrictions that will be imposed via digital ID, and that is more your preferred play than mucking about with dirt and fish, which is mine. Hedge that, at least.
Thanks!