Technical Analysis (4H Chart)
Price Action & Trend:
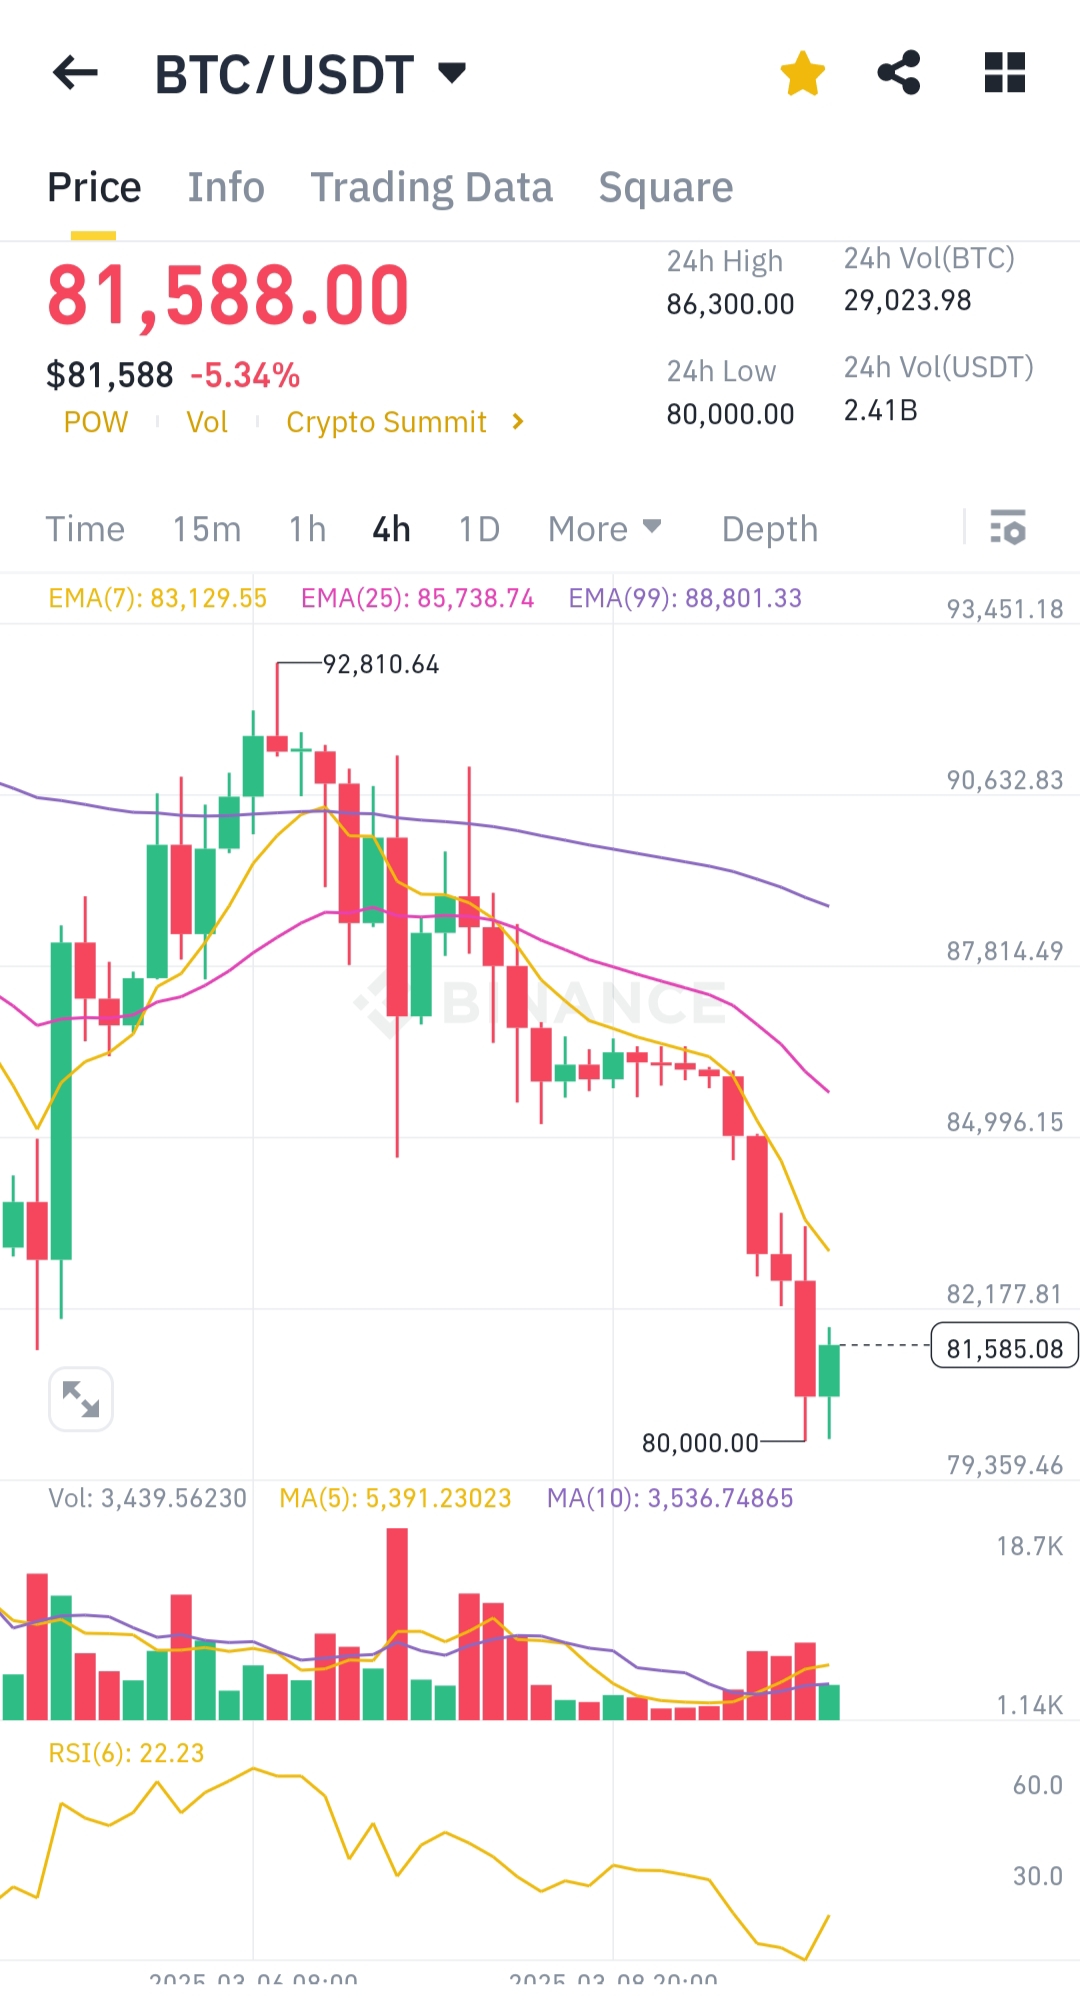
- BTC/USDT is trading at $81,588, down -5.34% in the last 4 hours.
- The price recently hit a low of $80,000, signaling a strong downward trend.
- A significant drop from $92,810.64 indicates selling pressure.
Moving Averages & EMA Levels:
- EMA (7) at $83,129.55 and EMA (25) at $85,738.74 indicate bearish momentum as BTC trades below these levels.
- EMA (99) at $88,801.33 suggests a long-term resistance point.
Support & Resistance:
- Support: Immediate support lies at $80,000, which held during the last price drop. A break below may lead to $79,359 or lower.
- Resistance: Key resistance levels are $82,177, followed by $84,996.
Volume & Market Sentiment:
- Volume is relatively low at 3,439 BTC, indicating weak buyer interest.
- Selling pressure remains dominant.
RSI (6) at 22.23 (Oversold Zone):
- RSI is deep in oversold territory, suggesting a potential short-term rebound.
- However, without strong buying volume, recovery may be weak.
Conclusion
Bitcoin is heavily bearish, but oversold RSI suggests a possible short-term bounce. Watch the $80,000 support—if it breaks, expect further downside. A rebound could test $82,000-$84,000, but sellers still dominate.
You received an upvote of 16% from Precious the Silver Mermaid!
Please remember to contribute great content to the #SilverGoldStackers tag to create another Precious Gem.