My first real post! You can learn more about me here
Whilst exploring steemit and learning more about how everything works, I tried looking at things the way I enjoy most, through data!
This a quick analysis I did of the tags summary data using Python (would love to learn if there are better ways of formatting code in posts!). I tried getting a feel for post, comments and payouts on steemit based the post tags.
I've left the code inline if you're interested!
Here is a link to the full Jupyter notebook as well (including the raw data) https://gist.github.com/michael-erasmus/4e7334537a445f3e5830cde9d7db644c
If you enjoyed this post and would like to see more stuff like this, let me know! (and upvote!)
%matplotlib inline
import pandas as pd
import matplotlib.pyplot as plt
from matplotlib.ticker import FuncFormatter
import seaborn as sns

sns.set_style('whitegrid')
Read in data derived from trending topics list
This was collected on 2017-07-21 22:46:42 (UTC)
df = pd.read_csv('tags.csv')
df.head()
| Tag | Posts | Comments | Payouts | |
|---|---|---|---|---|
| 0 | aceh | 4399 | 805 | 55180.578 |
| 1 | adventure | 1474 | 494 | 147060.430 |
| 2 | advice | 554 | 210 | 21937.755 |
| 3 | altcoin | 627 | 105 | 19558.774 |
| 4 | amazing | 617 | 85 | 2204.555 |
A quick look at the summary stats
df.describe()
| Posts | Comments | Payouts | |
|---|---|---|---|
| count | 249.000000 | 249.000000 | 2.490000e+02 |
| mean | 1931.751004 | 1866.923695 | 1.743020e+05 |
| std | 4419.145897 | 5418.708141 | 4.639500e+05 |
| min | 1.000000 | 32.000000 | 0.000000e+00 |
| 25% | 422.000000 | 206.000000 | 1.679843e+04 |
| 50% | 667.000000 | 408.000000 | 4.425472e+04 |
| 75% | 1387.000000 | 1074.000000 | 1.194865e+05 |
| max | 42928.000000 | 43884.000000 | 4.091146e+06 |
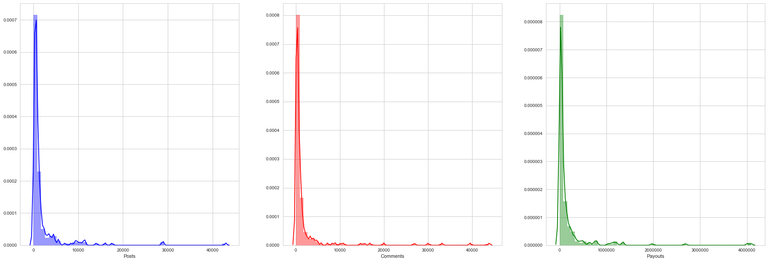
Let's see a quick distribution of Posts, Comments and Payouts
fig, (ax1, ax2, ax3) = plt.subplots(ncols=3, figsize=(30,10))
sns.distplot(df.Posts, ax=ax1, color='b')
sns.distplot(df.Comments, ax=ax2, color='r')
sns.distplot(df.Payouts, color='g')
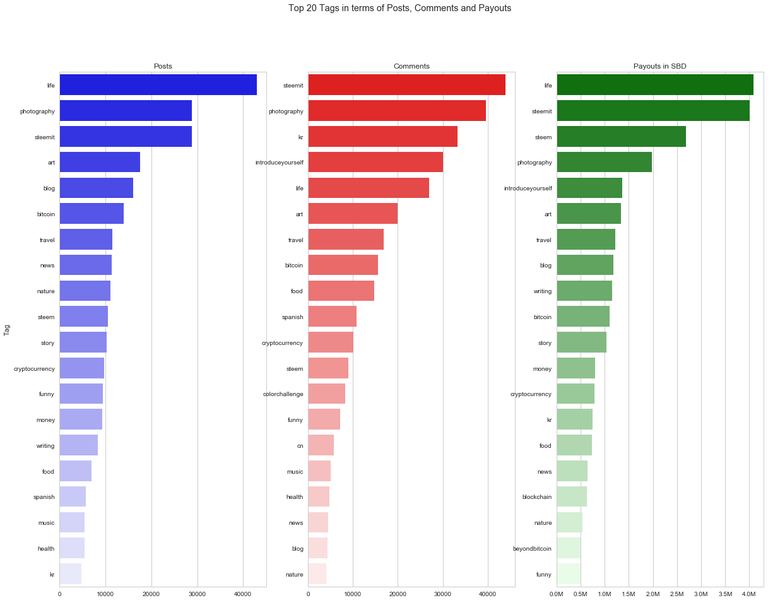
Let's look at the top 20 tags in terms of Posts, Comments, and Payouts
top = lambda n, by: df.sort_values(by=by, ascending=False).head(n)
payout_formatter = FuncFormatter(lambda x,p: '%1.1fM' % (x*1e-6))

fig, (ax1,ax2,ax3) = plt.subplots(figsize=(20,15), ncols=3)

sns.barplot(y='Tag', x='Posts',
            palette=sns.light_palette("blue", n_colors=20, reverse=True),
            data=top(20, "Posts"),
            ax=ax1)
ax1.set(title="Posts", xlabel='')

sns.barplot(y='Tag', x='Comments',
            palette=sns.light_palette("red", n_colors=20, reverse=True),
            data=top(20, "Comments"),
            ax=ax2)
ax2.set(title="Comments", xlabel='', ylabel='')

sns.barplot(y='Tag', x='Payouts',
            palette=sns.light_palette("green", n_colors=20, reverse=True),
            data=top(20, "Payouts"),
            ax=ax3)

ax3.set(title="Payouts in SBD", xlabel='', ylabel='')
ax3.xaxis.set_major_formatter(payout_formatter)

fig.suptitle('Top 20 Tags in terms of Posts, Comments and Payouts')
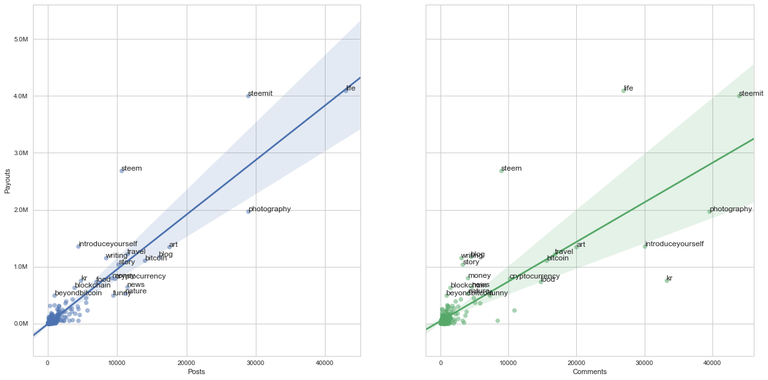
Let's look at the Payout's in terms of posts and comments
df = df.sort_values(by="Payouts", ascending=False)
fig, (ax1,ax2) = plt.subplots(figsize=(20,10), ncols=2, sharey=True)

sns.regplot(x='Posts',
            y='Payouts',
            scatter_kws={'alpha':0.5},
            data=df,
            ax=ax1)

for i, tag in enumerate(df.Tag.head(20)):
    ax1.annotate(tag,(list(df.Posts)[i],list(df.Payouts)[i]))

ax1.yaxis.set_major_formatter(payout_formatter)


sns.regplot(x='Comments',
            y='Payouts',
            scatter_kws={'alpha':0.5},
            data=df,
            ax=ax2)

#Annotate the top 20 in terms of payout
for i, tag in enumerate(df.Tag.head(20)):
    ax2.annotate(tag,(list(df.Comments)[i],list(df.Payouts)[i]))

ax2.yaxis.set_major_formatter(payout_formatter)
ax2.set(ylabel='')
What's the payout per post/comment for tags?
It's important to note that this is not the same as the "Average Post/Comment Payout"!
Because we only have the Total Payout without knowing how much is allocated for Posts and Comments, the exact ratio might not be too useful, but can still give us a rough idea how the tags compare against each other.
df['payout_per_post'] = df.Payouts / df.Posts
df[['Tag', 'Posts', 'payout_per_post']] \
    .sort_values(by='payout_per_post', ascending=False)\
    .head(20) \
    .reset_index() \
    .drop('index', axis=1)
| Tag | Posts | payout_per_post | |
|---|---|---|---|
| 0 | bitshares | 286 | 1105.515846 |
| 1 | steemfest | 125 | 925.923792 |
| 2 | witness-category | 113 | 844.448761 |
| 3 | meetup | 112 | 643.752375 |
| 4 | beyondbitcoin | 994 | 500.433907 |
| 5 | steem-help | 211 | 469.506502 |
| 6 | steem-pocalypse | 38 | 411.794526 |
| 7 | curation | 371 | 368.283876 |
| 8 | security | 530 | 353.183917 |
| 9 | coinkorea | 481 | 339.354857 |
| 10 | crypto-news | 984 | 326.677209 |
| 11 | gridcoin | 75 | 319.262480 |
| 12 | charlesfuchs | 8 | 317.167500 |
| 13 | introduceyourself | 4430 | 306.785769 |
| 14 | stats | 402 | 296.285604 |
| 15 | marketing | 560 | 274.113300 |
| 16 | economics | 470 | 264.304479 |
| 17 | steem | 10607 | 253.045986 |
| 18 | steemvoter | 114 | 252.183789 |
| 19 | eos | 362 | 251.570713 |
Let's do the same thing for comments
df['payout_per_comment'] = df.Payouts / df.Comments
df[['Tag', 'Comments', 'payout_per_comment']] \
    .sort_values(by='payout_per_comment', ascending=False) \
    .head(20) \
    .reset_index() \
    .drop('index', axis=1)
| Tag | Comments | payout_per_comment | |
|---|---|---|---|
| 0 | creativity | 163 | 1481.952816 |
| 1 | minnowsunite | 170 | 1479.143265 |
| 2 | future | 35 | 1348.421343 |
| 3 | finance | 48 | 1218.871104 |
| 4 | marketing | 142 | 1081.010197 |
| 5 | review | 66 | 1028.849197 |
| 6 | security | 215 | 870.639423 |
| 7 | work | 87 | 633.268655 |
| 8 | stats | 190 | 626.877963 |
| 9 | creative | 143 | 610.995790 |
| 10 | beyondbitcoin | 816 | 609.597186 |
| 11 | china | 49 | 605.306388 |
| 12 | recipe | 161 | 587.820820 |
| 13 | government | 104 | 578.813019 |
| 14 | anarchism | 295 | 568.976651 |
| 15 | girls | 127 | 507.826693 |
| 16 | fun | 246 | 470.909626 |
| 17 | recipes | 256 | 466.744328 |
| 18 | painting | 237 | 466.703169 |
| 19 | tutorial | 132 | 452.375341 |
Great stuff! I'm just doing my first baby steps in Python.
I will try this out. Will see if I can do it in my Ide since I don't have Jupyter installed
Awesome, good luck. Happy to help out, if you had any questions feel free to reach out!
@helium Thanks for posting.
Thanks for reading @jonrhythmic!
Congratulations @helium! You have completed some achievement on Steemit and have been rewarded with new badge(s) :
Click on any badge to view your own Board of Honor on SteemitBoard.
For more information about SteemitBoard, click here
If you no longer want to receive notifications, reply to this comment with the word
STOP